
Patient’s Right to Trial Act: Potential Impact of Adoption in All 50 States
A conditional schedule-shift model of state legislation that lets post-Phase-1 treatments finance their own evidence generation and accelerates treatments for global diseases and aging.
Keywords
right-to-try, right-to-trial, state-policy, clinical-trials, pragmatic-trials, health-economics, cost-effectiveness, patient-access, aging
Please help us improve this impact analysis. We want to help policymakers and the public understand the enormous potential benefits of universal patient access to clinical trials and a continually learning system for global treatment-effectiveness rankings and outcome labels. Comment below, or highlight any text and log in with Hypothesis to leave a note. Co-authors welcome.
1 The short version
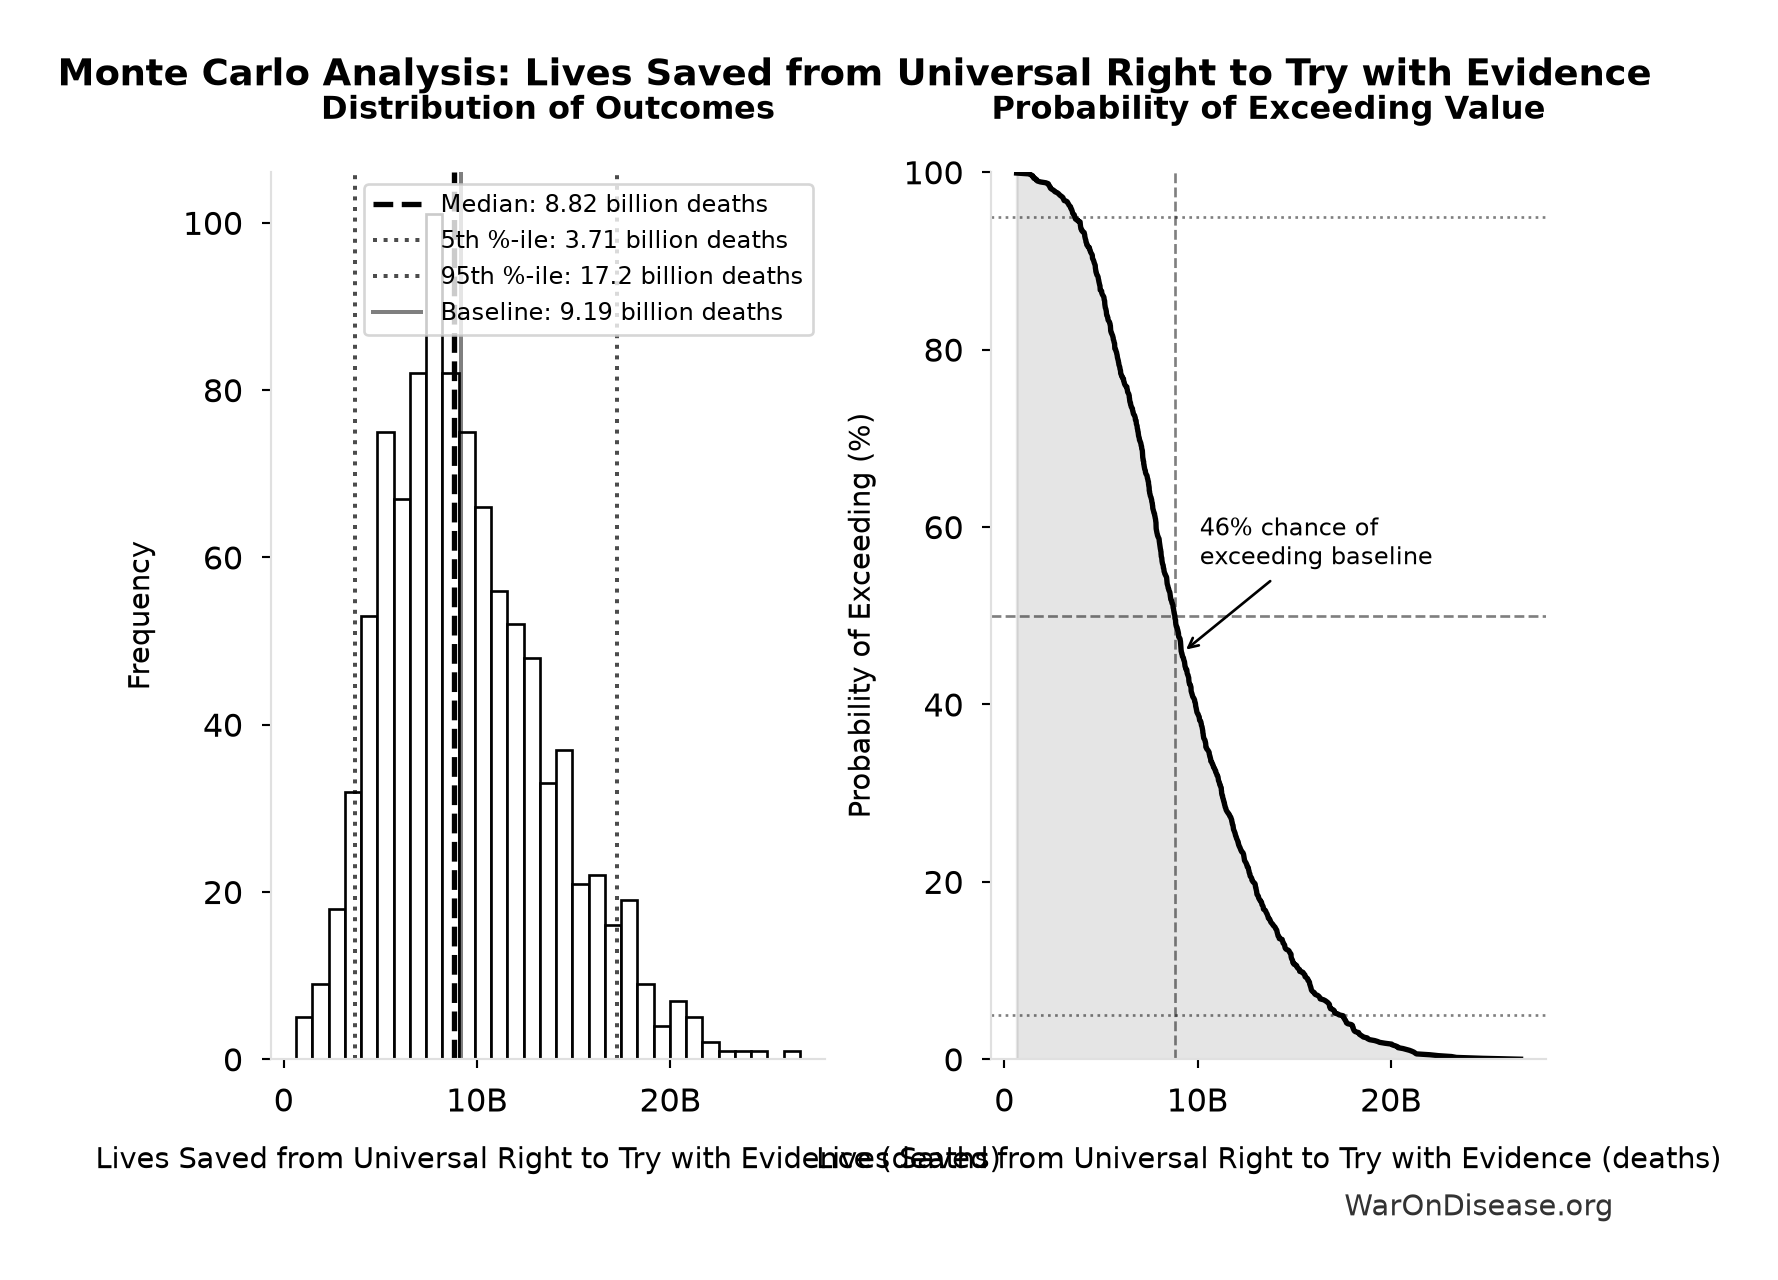
If all 50 states adopt Universal Right to Try35 with Evidence and the mature system produces the modeled increase in treatment discovery, the average first effective treatment arrives 181 years (90% CI: 79.1 years-332 years) sooner. Summed across future generations, that schedule shift prevents 189 billion years (90% CI: 75.2 billion years-358 billion years) of disability-equivalent suffering, averts roughly 9.19 billion deaths (90% CI: 3.71 billion deaths-17.2 billion deaths) from diseases and aging, and restores 483 billion DALYs (90% CI: 195 billion DALYs-907 billion DALYs) of healthy life. Each range is the 90% interval (5th to 95th percentile) from the model’s Monte Carlo simulation. These are conditional lifetime totals, not a count of people alive today, and passing a law does not automatically produce the modeled scientific effect.
The scale comes from a queue calculation. About 6,650 diseases (90% CI: 5,700 diseases-8,232 diseases) rare diseases still have no effective treatment, and roughly 15 diseases receive their first effective treatment each year. At that pace, exploring the queue takes approximately 443 years (90% CI: 255 years-841 years), and the average therapeutic target waits about 222 years (90% CI: 128 years-420 years). The model uses this queue as a proxy for the wider therapeutic frontier and asks how much the wait shrinks if the discovery rate rises.
The problem is not a shortage of possible treatments. Many post-Phase-1 compounds, repurposed drugs, combinations, doses, and disease-specific uses are never tested because nobody can finance conventional Phase 2 and Phase 3 trials.
Universal Right to Try with Evidence changes that financing constraint. Licensed centers provide eligible experimental treatments while patients or payers cover treatment-related care, trial-site services, and permitted study costs. Trial participants follow shared protocols, and other eligible uses contribute separately labeled observational outcomes. Treatments that were not economically viable to investigate become testable. State law does not waive federal authorization or evidence requirements.
Implementation costs about $65 million (95% CI: $25 million-$200 million): the 50-state campaign, common evidence standards, and the shared registry’s first ten years, after which participating centers fund the registry. At the central estimate, that is $0.000134 (90% CI: $0.000041-$0.00044) per healthy year restored.
Simulation Results Summary: Lives Saved from Universal Right to Try with Evidence
| Statistic | Value |
|---|---|
| Baseline (deterministic) | 9.19 billion |
| Mean (expected value) | 9.4 billion |
| Median (50th percentile) | 8.82 billion |
| Standard Deviation | 4.13 billion |
| 90% Range (5th-95th percentile) | [3.71 billion, 17.2 billion] |
The histogram shows 1,000 of the 10,000 Monte Carlo draws for Lives Saved from Universal Right to Try with Evidence; the summary statistics use all 10,000. The exceedance curve (right) shows the probability of the outcome exceeding any given value.
2 What the legislation changes
Montana has already created licensed experimental treatment centers. Senate Bill 535 covers treatments that have completed Phase 1 but are not approved for general FDA use. It permits centers to establish payment arrangements, charges a $10,000 license application fee and $5,000 annual renewal fee, and directs 2% of annual net profits toward access for qualifying Montana residents36.
That creates a lawful state-regulated place to provide experimental treatment. It does not by itself create a clinical trial system. Montana’s rules require centers to track treatment, patient outcomes, and serious adverse events, but the rules explicitly state that the centers do not administer clinical trials37. Observational outcomes can reveal promising or dangerous signals. Without a credible comparison, they cannot reliably show that a treatment caused the result.
The model bill adds four requirements:
- Enroll. Register a prospective protocol, obtain informed consent, report serious safety events, and place each patient in the applicable federal trial or treatment-access pathway.
- Compare. Prespecify outcomes and use simple randomization or another adequate control when feasible. Without an adequate comparison, label the result a signal, not a validated treatment effect.
- Pool. Send standardized, de-identified baseline and outcome data to a shared registry.
- Publish. Continuously publish results for each treatment-condition pair, including negative and harmful results.
The result is access with evidence. Participating patients receive treatments that sponsors make available and contribute to a common learning system. Every result can improve the next treatment decision.
3 Why treatments that cannot attract conventional funding matter
A candidate treatment can have completed initial human safety testing and still be commercially impossible to develop. A conventional Phase 3 trial costs about $41,000 (95% CI: $20,000-$120,000) per participant. The existing model estimates that an embedded pragmatic trial can reduce that to approximately $929 (95% CI: $97-$3,000) per participant, a 44.1x (90% CI: 12.8x-210x) reduction.
That does not mean every trial becomes 44.1x (90% CI: 12.8x-210x) cheaper. Complex and high-risk studies will still need specialized sites, procedures, and monitoring. It means routine care can often replace dedicated research visits and duplicate data collection while retaining prespecified outcomes, safety reporting, reliable analysis, and a comparison group.
The pool of stranded candidates is large: roughly 9,500 compounds (95% CI: 7,000 compounds-12,000 compounds) with established human safety profiles, counting approved drugs and food substances already recognized as safe, and most sit outside patent protection. The moment a trial proves a cheap unpatented compound works, any manufacturer can sell it at commodity prices, so no sponsor can recoup a conventional Phase 3 bill. Metformin is the standard example: an FDA-cleared trial of the generic diabetes drug against aging itself, tracking 3,000 people over five years at an estimated $30 million to $50 million, sat unfunded for more than six years because no company could profit from a positive result38.
The candidate pool is much larger than a count of compounds. One compound may be tested for several diseases, doses, combinations, or subtypes. Additional candidates do not multiply disease burden. They increase the chance that the first effective treatment for each condition is found sooner.
4 One policy-effect input instead of a pretend forecast
Nobody knows how many centers will open, how many patients will enroll, how many shelved treatments will return, or what fraction of well-designed evaluations will find an effective treatment. Modeling each unknown as a separate multiplier would manufacture precision and create opportunities to count the same benefit twice.
The model compresses the entire policy mechanism into one uncertain input: a treatment-discovery multiplier of 5.48x (95% CI: 1.1x-15x). It represents:
- patient or payer funding of treatment and evidence generation;
- treatments revived because conventional trials were not economically viable;
- enough candidate-condition pairs and eligible participants to sustain evaluation;
- protocols capable of producing credible efficacy evidence; and
- the share of completed evaluations that find a first effective treatment.
The central value is a calibration assumption, not an observed causal estimate. The automatic Monte Carlo samples uncertainty in this multiplier, launch cost, avoidable disease burden, and their upstream inputs. It does not capture political adoption risk or model-form uncertainty in using the rare-disease queue as a proxy for the wider therapeutic frontier. The physical health totals are undiscounted. Applying a time discount rate would reduce their present value, but adding a preferred discount rate would not change the underlying schedule shift.
5 The calculation, one step at a time
The arithmetic asks how much sooner the average first treatment arrives if the discovery rate increases:
| Step | Question | Conditional result |
|---|---|---|
| 1 | How long would the remaining treatment queue take at the current discovery rate? | |
| 2 | How long does the average therapeutic target wait? | |
| 3 | How much earlier does treatment arrive at the modeled discovery rate? | |
| 4 | How many global healthy years does that schedule shift restore? | 483 billion DALYs (90% CI: 195 billion DALYs-907 billion DALYs) |
| 5 | What is the campaign and registry-launch cost per restored healthy year? |
The full calculation is:
\[
\begin{gathered}
Cost_{RTT,DALY} \\
= \frac{C_{RTT}}{DALYs_{RTT}} \\
= \frac{\$65M}{483B} \\
= \$0.000134
\end{gathered}
\]
where:
\[
\begin{gathered}
DALYs_{RTT} \\
= DALYs_{global,ann} \times Pct_{avoid,DALY} \times T_{accel,RTT} \\
= 2.88B \times 92.6\% \times 181 \\
= 483B
\end{gathered}
\]
where:
\[
\begin{gathered}
T_{accel,RTT} \\
= T_{first,SQ} \times \left(1 - \frac{1}{k_{RTT}}\right) \\
= 222 \times \left(1 - \frac{1}{5.48}\right) \\
= 181
\end{gathered}
\]
where:
\[
\begin{gathered}
T_{first,SQ} \\
= T_{queue,SQ} \times 0.5 \\
= 443 \times 0.5 \\
= 222
\end{gathered}
\]
where:
\[
\begin{gathered}
T_{queue,SQ} \\
= \frac{N_{untreated}}{Treatments_{new,ann}} \\
= \frac{6{,}650}{15} \\
= 443
\end{gathered}
\]
where:
\[
\begin{gathered}
N_{untreated} \\
= N_{rare} \times 0.95 \\
= 7{,}000 \times 0.95 \\
= 6{,}650
\end{gathered}
\]
The rare-disease treatment queue is the clearest available count of diseases still awaiting a first effective treatment. The model uses it as a proxy for the pace of exploring the wider therapeutic frontier, then applies the resulting schedule shift to eventually avoidable global disease and aging-related burden. That is the model’s strongest assumption. It is stated directly because it drives the scale of the result.
6 What the headline numbers mean
The estimate of 9.19 billion premature deaths prevented exceeds the current world population because it sums deaths prevented across approximately 181 years of future generations. It is a schedule-shift estimate, not a count of currently identifiable people.
The 189 billion years of suffering are disability-weighted equivalents (1.65 quadrillion hours, if you prefer to be horrified hourly). A disability weight of 0.25 sustained for four years counts as one full-disability-equivalent year. It does not mean that every year represents maximum conscious pain.
The global estimate assumes discoveries become public knowledge and eventually benefit patients outside the United States. The access right itself remains state law.
The model does not count the uncertain direct health effect on participating patients. Earlier access to an effective treatment could help them immediately. Ineffective or unsafe treatments could harm them. Those effects are real, but they are a separate channel from the treatment-discovery schedule shift and are not included in the headline totals.
7 What it costs
The launch cost is $65 million (95% CI: $25 million-$200 million): the 50-state campaign, common evidence standards, and the shared registry’s first ten years. Participating centers then sustain the registry through license or enrollment assessments. The model does not require a new state appropriation.
The conditional cost per DALY divides that launch cost by the health benefit if all 50 states adopt and the mature system produces the modeled discovery rate. It excludes patient and payer spending on treatment delivery because those payments buy care and evidence generation rather than consuming the launch budget.
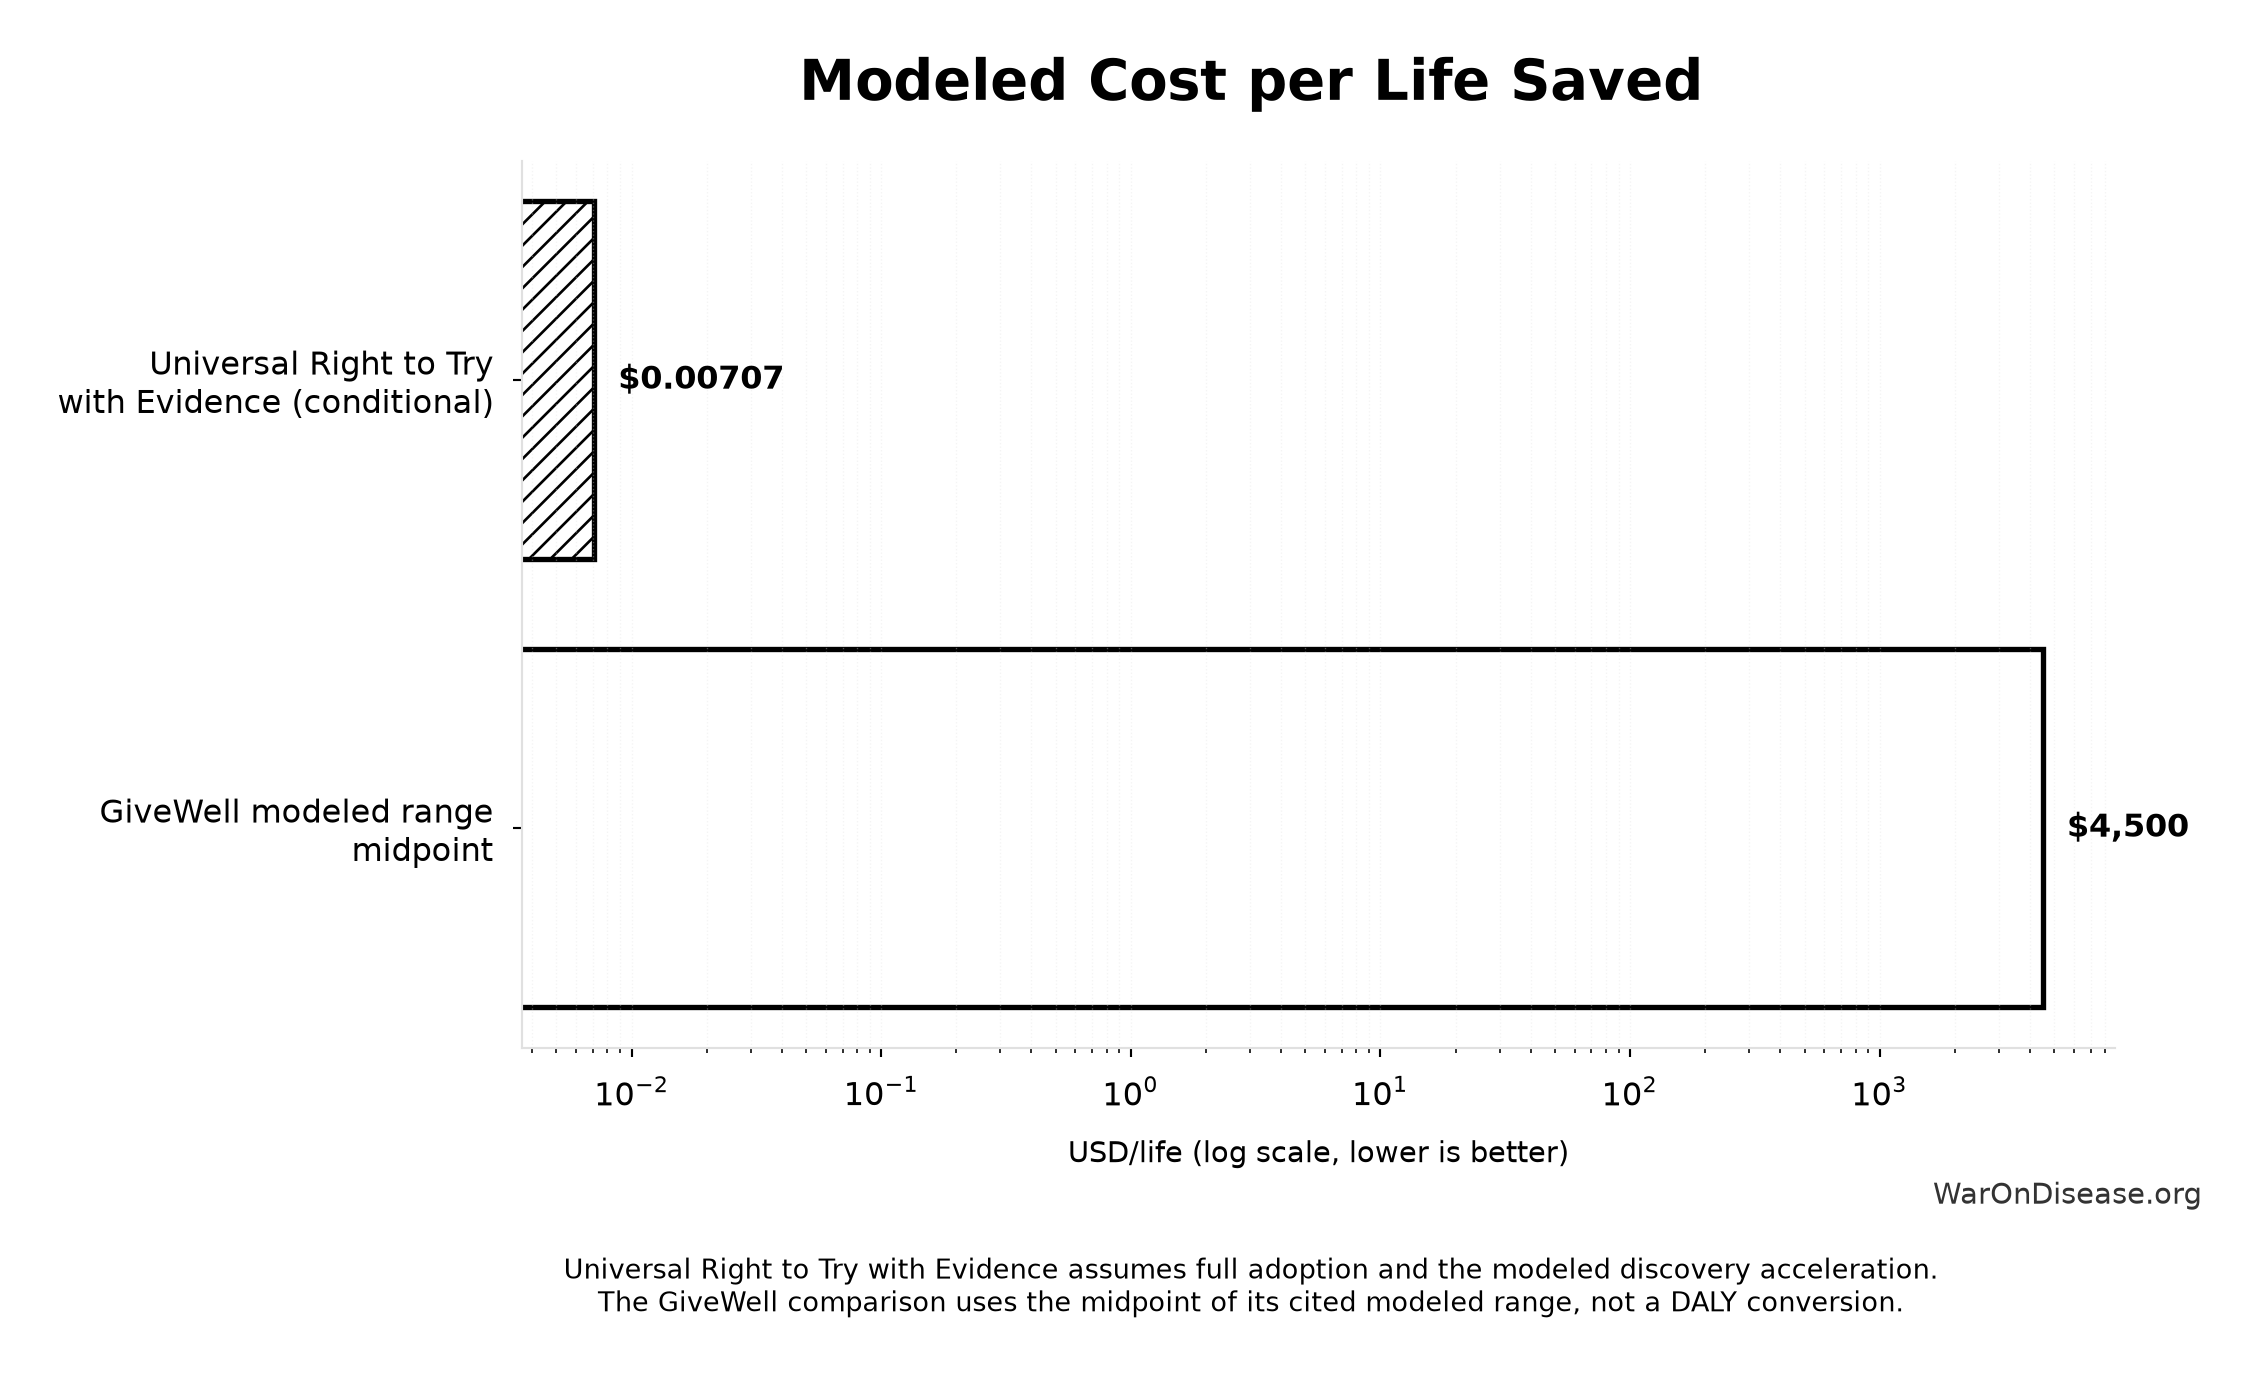
At the central estimate, the modeled launch cost per life saved is $0.00707 (90% CI: $0.00213-$0.023). The midpoint of GiveWell’s cited modeled range across top charities is 636.2k times that figure3. The scopes differ: the GiveWell number counts full program costs, while this numerator counts only the campaign and registry launch that unlock treatment, sponsor, payer, clinic, and investor spending.
Three economic effects are left out because each is hard to estimate and they overlap one another and the discovery multiplier: price competition once several post-Phase-1 treatments target the same condition, substitution of cheap unpatented treatments for expensive patented ones, and lower medical and caregiving spending when aging and chronic disease are treated earlier. Summing them would double count. The model treats them the way it treats the direct participant effect: real, unmodeled, and excluded from the headline totals. Every excluded channel biases the conditional cost per healthy year against the policy.
The cost-per-DALY Monte Carlo shows uncertainty in the conditional estimate itself:
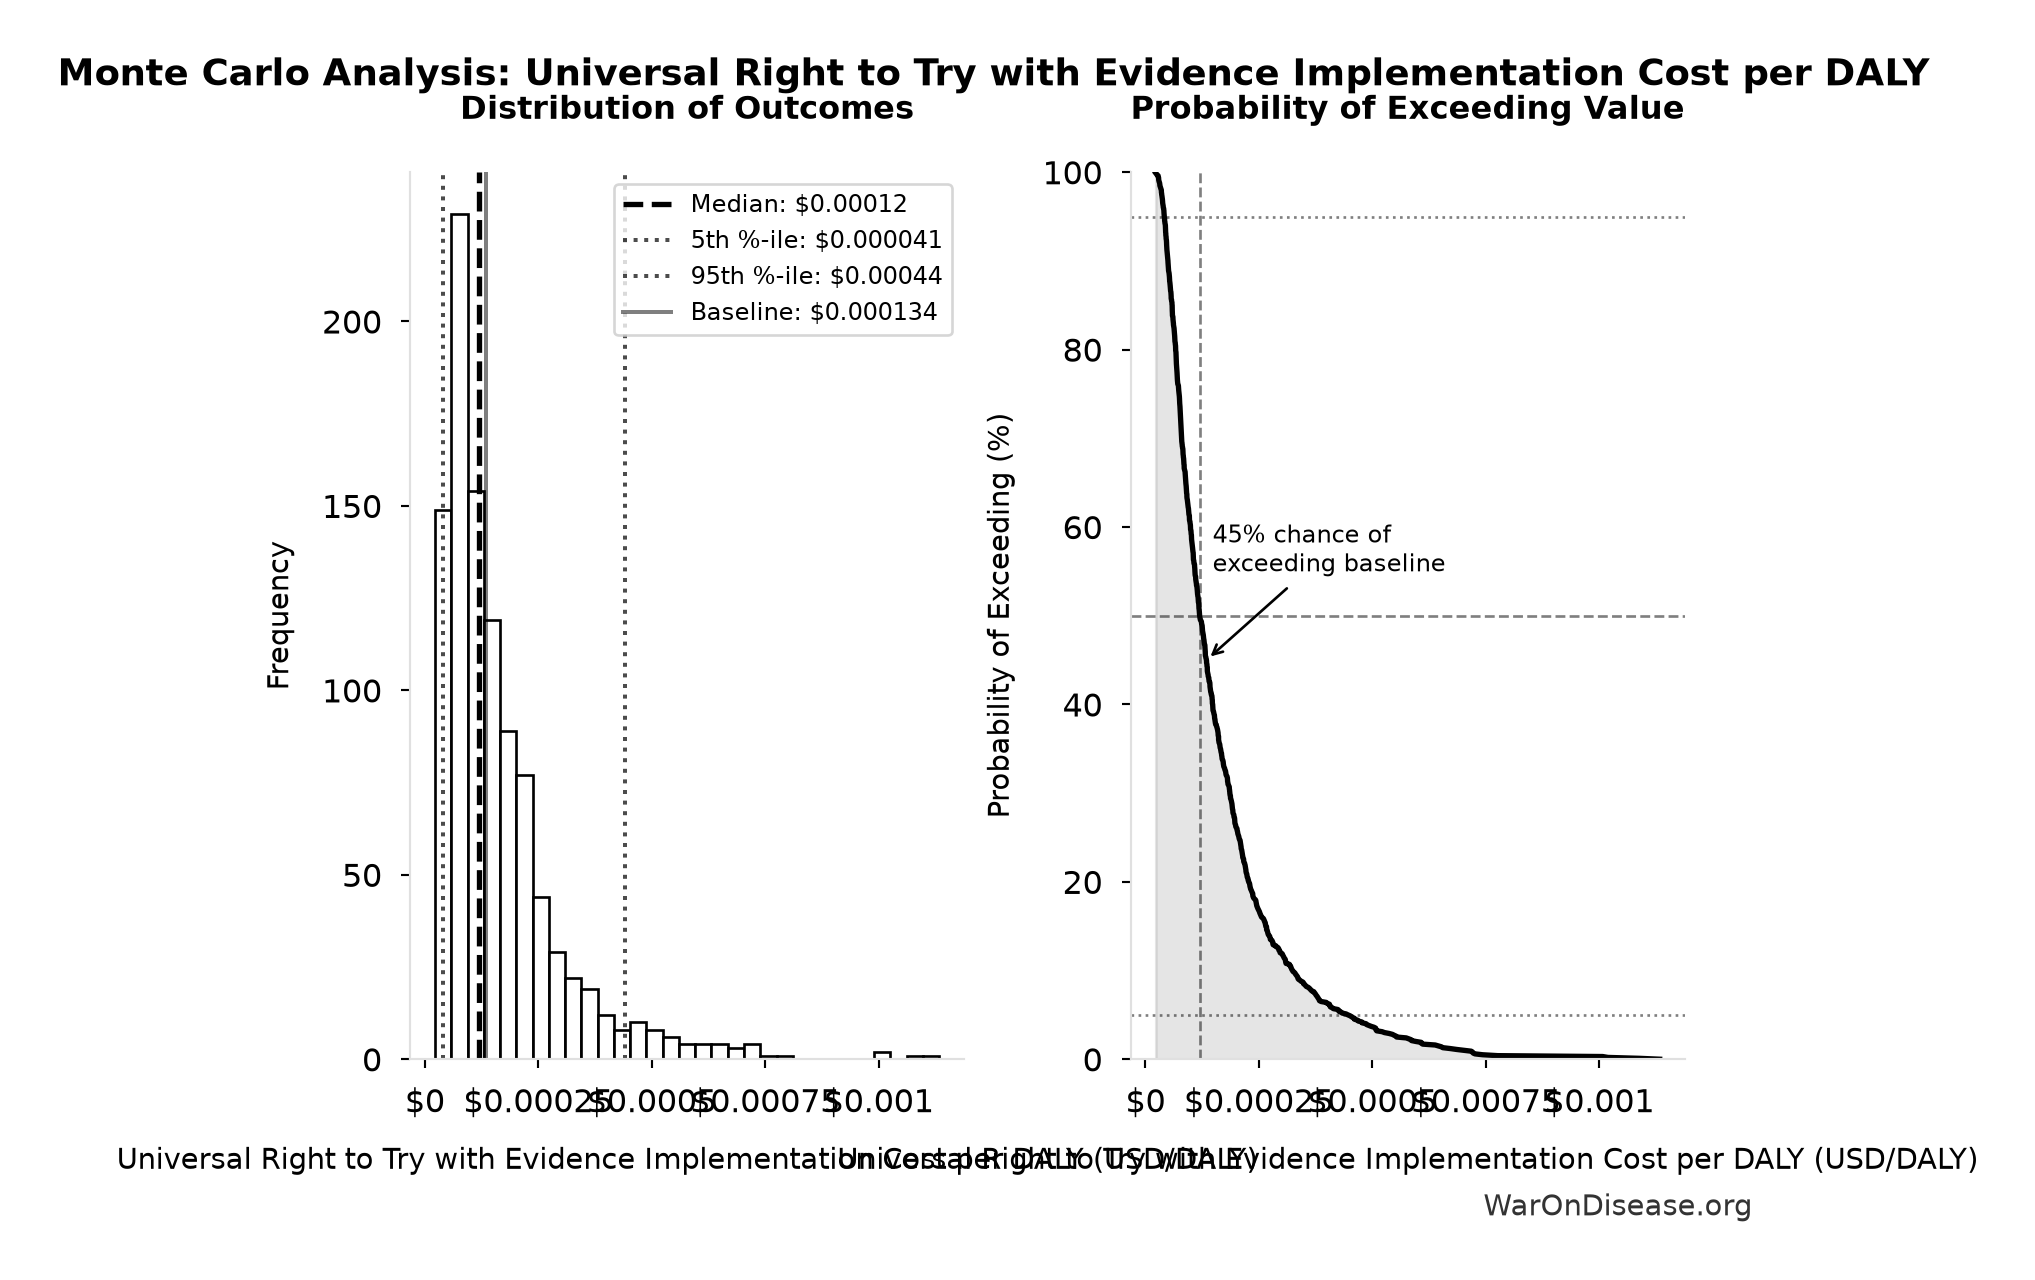
Simulation Results Summary: Universal Right to Try with Evidence Implementation Cost per DALY
| Statistic | Value |
|---|---|
| Baseline (deterministic) | $0.000134 |
| Mean (expected value) | $0.000169 |
| Median (50th percentile) | $0.00012 |
| Standard Deviation | $0.000183 |
| 90% Range (5th-95th percentile) | [$0.000041, $0.00044] |
The histogram shows 1,000 of the 10,000 Monte Carlo draws for Universal Right to Try with Evidence Implementation Cost per DALY; the summary statistics use all 10,000. The exceedance curve (right) shows the probability of the outcome exceeding any given value.
For any funding decision, multiply the conditional benefit by your own probability that the money produces full adoption, mature implementation, and the modeled scientific effect. Equivalently, divide the conditional cost per life saved by that probability. Keeping that judgment outside the model avoids another arbitrary scenario parameter.
8 What commercial capital can finance
Review, compliance, clinical administration, manufacturing, monitoring, data infrastructure, and successful treatment assets can all produce revenue. Commercial capital can therefore finance:
- experimental treatment review board services and compliance;
- licensed treatment and pragmatic-trial sites;
- manufacturing and distribution;
- treatment sponsors and holders of shelved post-Phase-1 assets;
- interoperable registry, analytics, and monitoring infrastructure; and
- payer contracts that condition coverage on evidence production.
The campaign, evidence standards, and registry are the one layer that cannot earn revenue; everything downstream can pay for itself.
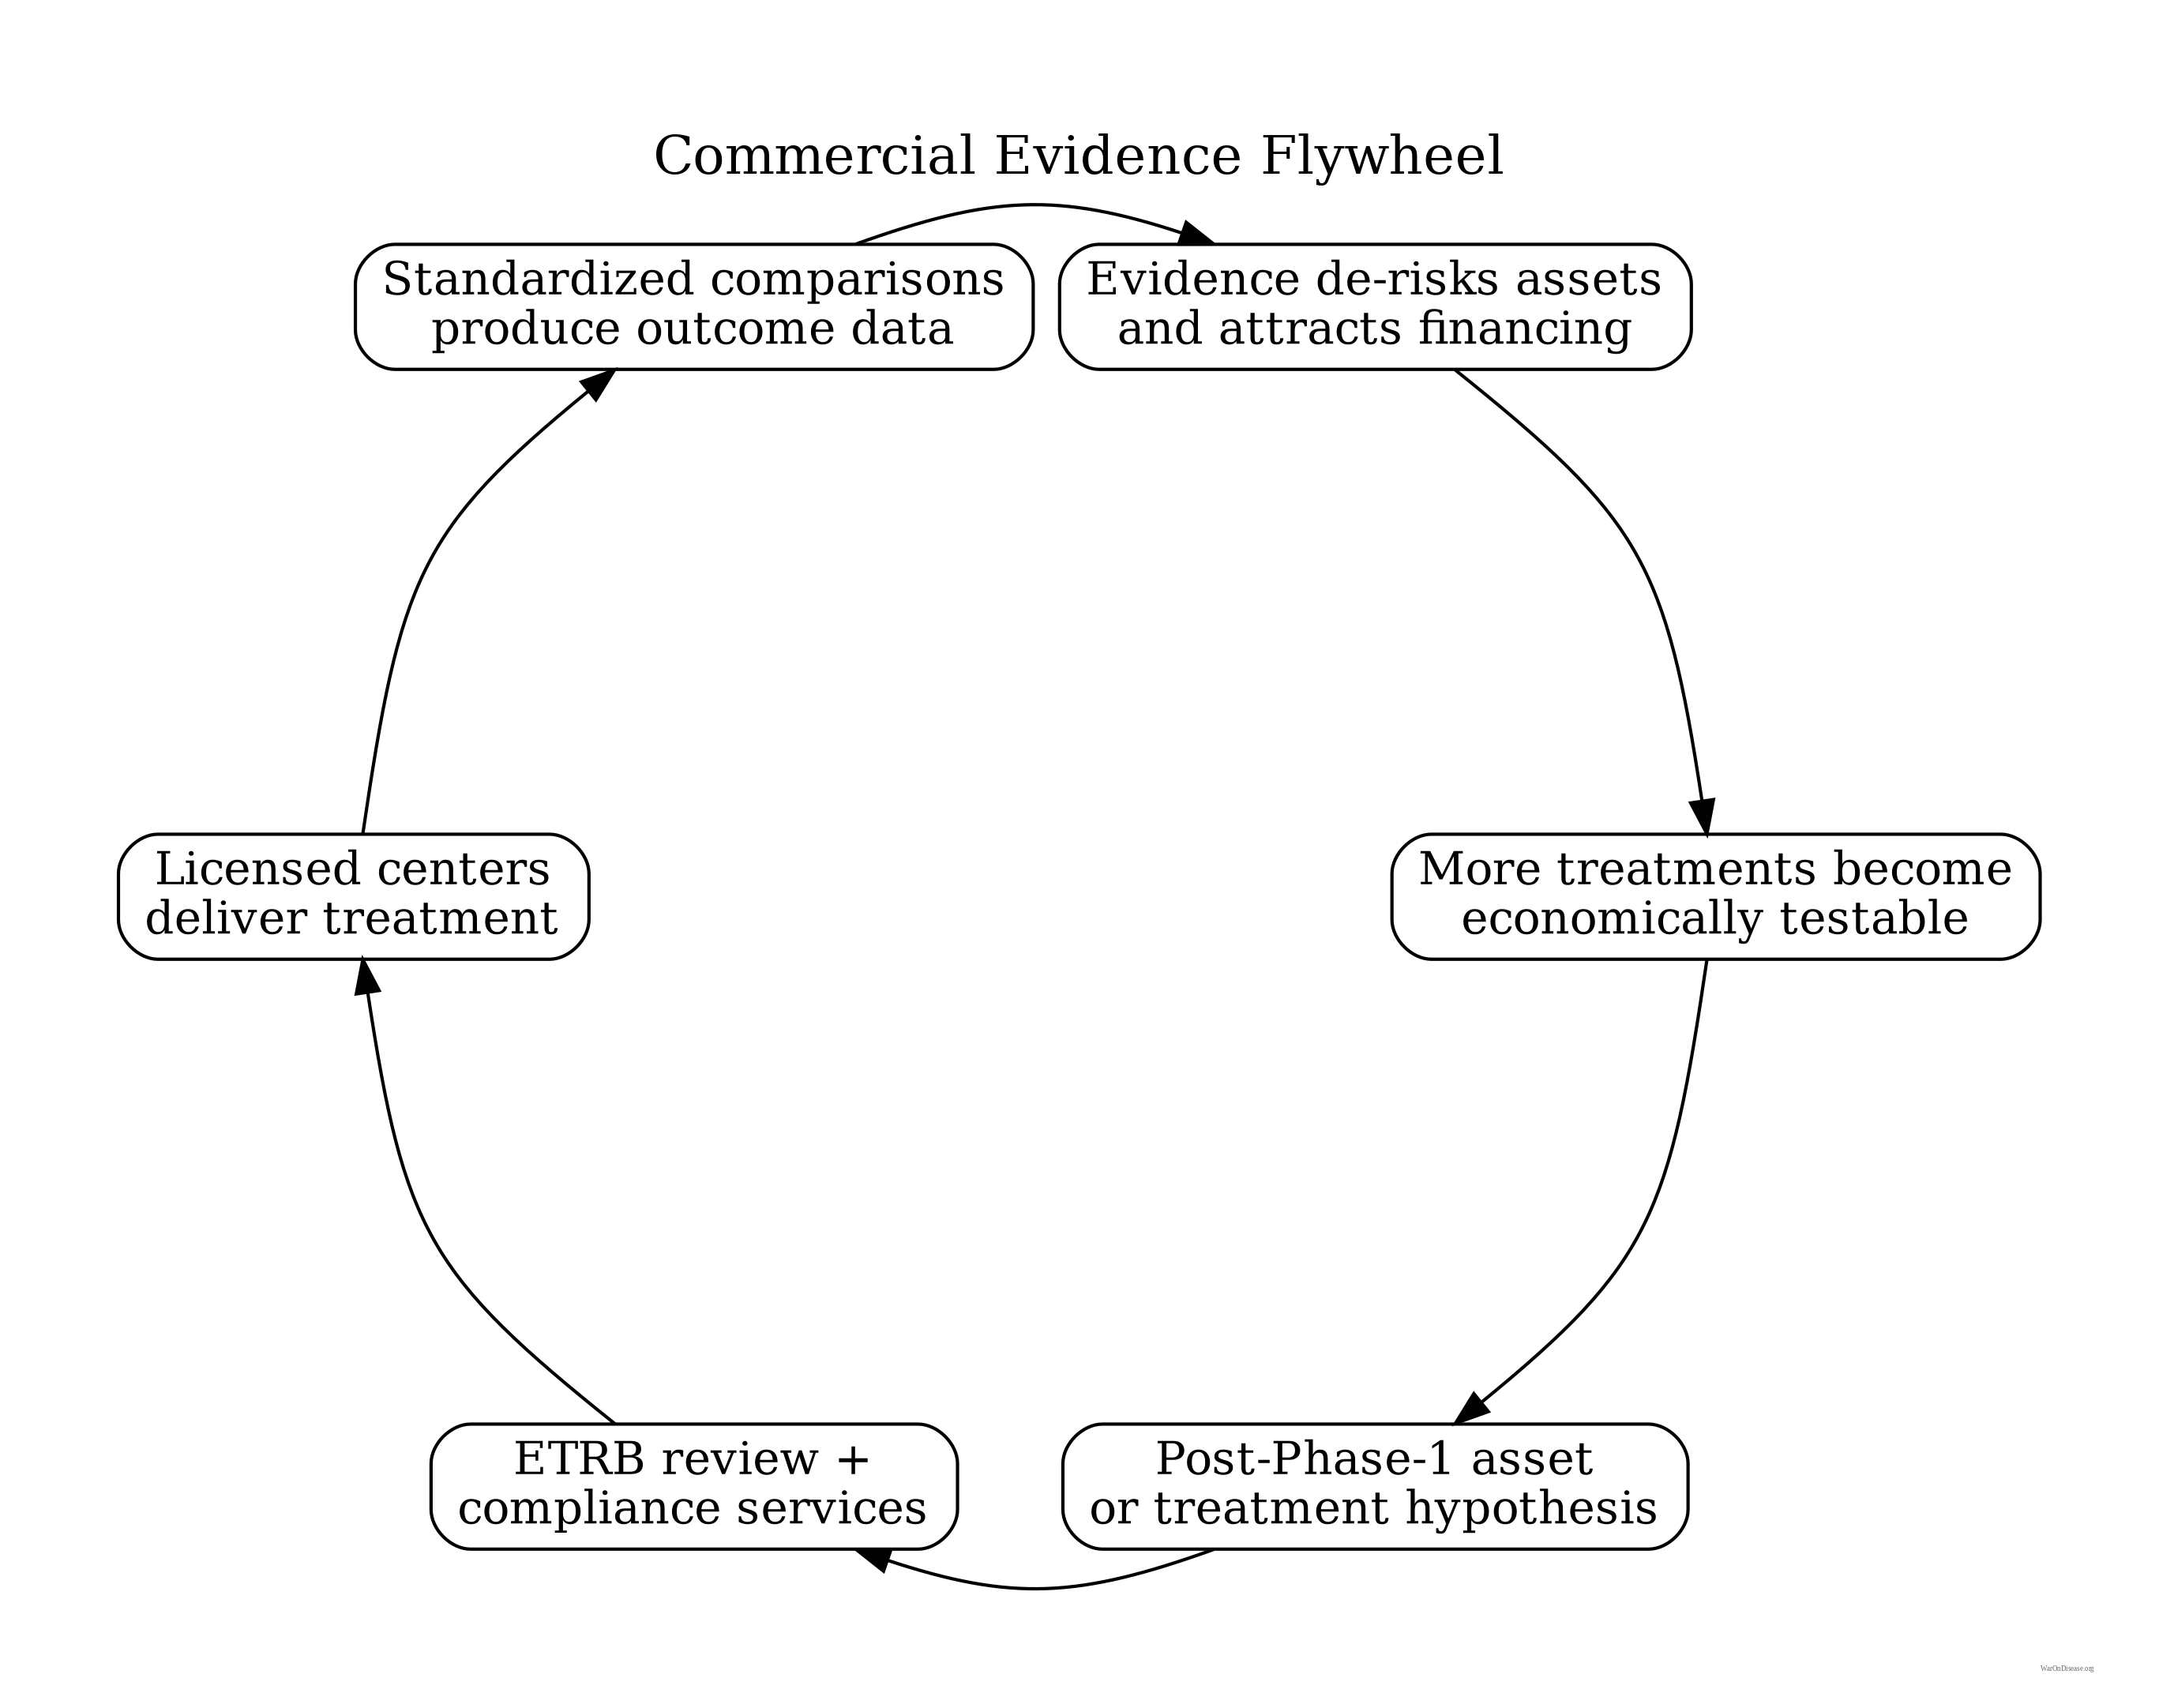
The flywheel maps possible cash flows, not promised investor returns. Actual returns depend on lawful charging, treatment demand, reimbursement, liability, protocol quality, and whether the evidence changes clinical or regulatory decisions.
9 The federal boundary
State legislation does not approve drugs, waive federal trial authorization, or lower FDA’s evidence standard. Federal Right to Try is limited to eligible patients who are unable to participate in a clinical trial involving the drug39. A patient enrolled in an interventional pragmatic trial must instead participate under an active investigational new drug application or another applicable FDA-authorized pathway. Patients who cannot join a trial may contribute separately labeled observational outcomes through federal Right to Try or expanded access if eligible.
FDA’s standard remains substantial evidence from adequate and well-controlled investigations. FDA guidance allows one rigorous investigation plus confirmatory evidence in some circumstances, while still requiring sufficient safety evidence and a favorable benefit-risk assessment40. FDA also supports streamlined randomized trials integrated into routine clinical practice41. Project Pragmatica applies this design logic to approved oncology products through simpler eligibility and routine-practice enrollment42. These programs show that pragmatic design can reduce collection burden. They do not authorize states to bypass federal law.
Federal charging rules also remain in force. An IND sponsor needs FDA authorization to charge for an investigational drug and generally may recover only direct drug costs. Trial sites may separately recover pharmacy, nursing, equipment, and study-related procedure costs without authorization under that charging rule43. The model therefore assumes that patients or payers cover treatment delivery, site services, and permitted study costs. Whether lawful revenue is sufficient to sustain the modeled discovery multiplier remains uncertain.
Medicare already uses the analogous payment principle in Coverage with Evidence Development. Specified services may be covered within an approved study while evidence is collected, then CMS can reconsider coverage using the results44. Universal Right to Try with Evidence applies the same basic idea outside Medicare: access now, standardized evidence from every use, and stronger decisions over time. The Continuous Evidence Generation Protocol45 provides one compatible technical design. The legislation does not need to mandate that specific protocol.
10 Montana can prove it works
Montana has already completed the politically difficult first step. It created the licensed-center and independent-review framework. Infinita describes a coordinated pathway involving experimental treatment review board review, licensed clinical administration, monitoring, evidence generation, and early commercialization for post-Phase-1 therapies46.
The next step is a transparent Montana demonstration that adds interoperable enrollment, credible comparisons, pooled outcomes, documented fees, and safety monitoring. If that system produces useful evidence while remaining commercially sustainable, other states have a model they can copy.
The original Right to Try model spread from its first state in 2014 to 41 states by 201847. That history establishes a distribution channel, not a guarantee. The evidence amendment must prove its value in operation.
Any implementing bill should require Enroll, Compare, Pool, and Publish. That turns 50 possible access experiments into one continually learning treatment system.
References
1.
NIH Common Fund. NIH pragmatic trials: Minimal funding despite 30x cost advantage. NIH Common Fund: HCS Research Collaboratory https://commonfund.nih.gov/hcscollaboratory (2025)
The NIH Pragmatic Trials Collaboratory funds trials at $500K for planning phase, $1M/year for implementation-a tiny fraction of NIH’s budget. The ADAPTABLE trial cost $14 million for 15,076 patients (= $929/patient) versus $420 million for a similar traditional RCT (30x cheaper), yet pragmatic trials remain severely underfunded. PCORnet infrastructure enables real-world trials embedded in healthcare systems, but receives minimal support compared to basic research funding. Additional sources: https://commonfund.nih.gov/hcscollaboratory | https://pcornet.org/wp-content/uploads/2025/08/ADAPTABLE_Lay_Summary_21JUL2025.pdf | https://www.ncbi.nlm.nih.gov/pmc/articles/PMC5604499/
.2.
NIH. Antidepressant clinical trial exclusion rates. Zimmerman et al. https://pubmed.ncbi.nlm.nih.gov/26276679/ (2015)
Mean exclusion rate: 86.1% across 158 antidepressant efficacy trials (range: 44.4% to 99.8%) More than 82% of real-world depression patients would be ineligible for antidepressant registration trials Exclusion rates increased over time: 91.4% (2010-2014) vs. 83.8% (1995-2009) Most common exclusions: comorbid psychiatric disorders, age restrictions, insufficient depression severity, medical conditions Emergency psychiatry patients: only 3.3% eligible (96.7% excluded) when applying 9 common exclusion criteria Only a minority of depressed patients seen in clinical practice are likely to be eligible for most AETs Note: Generalizability of antidepressant trials has decreased over time, with increasingly stringent exclusion criteria eliminating patients who would actually use the drugs in clinical practice Additional sources: https://pubmed.ncbi.nlm.nih.gov/26276679/ | https://pubmed.ncbi.nlm.nih.gov/26164052/ | https://www.wolterskluwer.com/en/news/antidepressant-trials-exclude-most-real-world-patients-with-depression
.3.
GiveWell. GiveWell cost per life saved for top charities (2024). GiveWell: Top Charities https://www.givewell.org/charities/top-charities
General range: $3,000-$5,500 per life saved (GiveWell top charities) Helen Keller International (Vitamin A): $3,500 average (2022-2024); varies $1,000-$8,500 by country Against Malaria Foundation: $5,500 per life saved New Incentives (vaccination incentives): $4,500 per life saved Malaria Consortium (seasonal malaria chemoprevention): $3,500 per life saved VAS program details: $2 to provide vitamin A supplements to child for one year Note: Figures accurate for 2024. Helen Keller VAS program has wide country variation ($1K-$8.5K) but $3,500 is accurate average. Among most cost-effective interventions globally Additional sources: https://www.givewell.org/charities/top-charities | https://www.givewell.org/charities/helen-keller-international | https://ourworldindata.org/cost-effectiveness
.4.
World Health Organization. WHO global health estimates 2024. World Health Organization https://www.who.int/data/gho/data/themes/mortality-and-global-health-estimates (2024)
Comprehensive mortality and morbidity data by cause, age, sex, country, and year Global mortality: 55-60 million deaths annually Lives saved by modern medicine (vaccines, cardiovascular drugs, oncology): 12M annually (conservative aggregate) Leading causes of death: Cardiovascular disease (17.9M), Cancer (10.3M), Respiratory disease (4.0M) Note: Baseline data for regulatory mortality analysis. Conservative estimate of pharmaceutical impact based on WHO immunization data (4.5M/year from vaccines) + cardiovascular interventions (3.3M/year) + oncology (1.5M/year) + other therapies. Additional sources: https://www.who.int/data/gho/data/themes/mortality-and-global-health-estimates
.5.
U.S. Bureau of Labor Statistics. CPI inflation calculator. (2024)
CPI-U (1980): 82.4 CPI-U (2024): 313.5 Inflation multiplier (1980-2024): 3.80× Cumulative inflation: 280.48% Average annual inflation rate: 3.08% Note: Official U.S. government inflation data using Consumer Price Index for All Urban Consumers (CPI-U). Additional sources: https://www.bls.gov/data/inflation_calculator.htm
.6.
ACS CAN. Clinical trial patient participation rate. ACS CAN: Barriers to Clinical Trial Enrollment https://www.fightcancer.org/policy-resources/barriers-patient-enrollment-therapeutic-clinical-trials-cancer
Only 3-5% of adult cancer patients in US receive treatment within clinical trials About 5% of American adults have ever participated in any clinical trial Oncology: 2-3% of all oncology patients participate Contrast: 50-60% enrollment for pediatric cancer trials (<15 years old) Note: 20% of cancer trials fail due to insufficient enrollment; 11% of research sites enroll zero patients Additional sources: https://www.fightcancer.org/policy-resources/barriers-patient-enrollment-therapeutic-clinical-trials-cancer | https://hints.cancer.gov/docs/Briefs/HINTS_Brief_48.pdf
.7.
ScienceDaily. Global prevalence of chronic disease. ScienceDaily: GBD 2015 Study https://www.sciencedaily.com/releases/2015/06/150608081753.htm (2015)
2.3 billion individuals had more than five ailments (2013) Chronic conditions caused 74% of all deaths worldwide (2019), up from 67% (2010) Approximately 1 in 3 adults suffer from multiple chronic conditions (MCCs) Risk factor exposures: 2B exposed to biomass fuel, 1B to air pollution, 1B smokers Projected economic cost: $47 trillion by 2030 Note: 2.3B with 5+ ailments is more accurate than "2B with chronic disease." One-third of all adults globally have multiple chronic conditions Additional sources: https://www.sciencedaily.com/releases/2015/06/150608081753.htm | https://pmc.ncbi.nlm.nih.gov/articles/PMC10830426/ | https://pmc.ncbi.nlm.nih.gov/articles/PMC6214883/
.8.
C&EN. Annual number of new drugs approved globally: 50. C&EN https://cen.acs.org/pharmaceuticals/50-new-drugs-received-FDA/103/i2 (2025)
50 new drugs approved annually Additional sources: https://cen.acs.org/pharmaceuticals/50-new-drugs-received-FDA/103/i2 | https://www.fda.gov/drugs/development-approval-process-drugs/novel-drug-approvals-fda
.9.
IQVIA Report. Global trial capacity. IQVIA Report: Clinical Trial Subjects Number Drops Due to Decline in COVID-19 Enrollment https://gmdpacademy.org/news/iqvia-report-clinical-trial-subjects-number-drops-due-to-decline-in-covid-19-enrollment/
1.9M participants annually (2022, post-COVID normalization from 4M peak in 2021) Additional sources: https://gmdpacademy.org/news/iqvia-report-clinical-trial-subjects-number-drops-due-to-decline-in-covid-19-enrollment/
.10.
Nature Medicine. Drug repurposing rate ( 30%). Nature Medicine https://www.nature.com/articles/s41591-024-03233-x (2024)
Approximately 30% of drugs gain at least one new indication after initial approval. Additional sources: https://www.nature.com/articles/s41591-024-03233-x
.11.
Biotechnology Innovation Organization (BIO). BIO clinical development success rates 2011-2020. Biotechnology Innovation Organization (BIO) https://go.bio.org/rs/490-EHZ-999/images/ClinicalDevelopmentSuccessRates2011_2020.pdf (2021)
Phase I duration: 2.3 years average Total time to market (Phase I-III + approval): 10.5 years average Phase transition success rates: Phase I→II: 63.2%, Phase II→III: 30.7%, Phase III→Approval: 58.1% Overall probability of approval from Phase I: 12% Note: Largest publicly available study of clinical trial success rates. Efficacy lag = 10.5 - 2.3 = 8.2 years post-safety verification. Additional sources: https://go.bio.org/rs/490-EHZ-999/images/ClinicalDevelopmentSuccessRates2011_2020.pdf
.12.
Institute for Health Metrics and Evaluation (IHME). IHME global burden of disease 2021 (2.88B DALYs, 1.13B YLD). Institute for Health Metrics and Evaluation (IHME) https://vizhub.healthdata.org/gbd-results/ (2024)
In 2021, global DALYs totaled approximately 2.88 billion, comprising 1.75 billion Years of Life Lost (YLL) and 1.13 billion Years Lived with Disability (YLD). This represents a 13% increase from 2019 (2.55B DALYs), largely attributable to COVID-19 deaths and aging populations. YLD accounts for approximately 39% of total DALYs, reflecting the substantial burden of non-fatal chronic conditions. Additional sources: https://vizhub.healthdata.org/gbd-results/ | https://www.thelancet.com/journals/lancet/article/PIIS0140-6736(24)00757-8/fulltext | https://www.healthdata.org/research-analysis/about-gbd
.13.
Sinn, M. P. Private industry clinical trial spending estimate. (2025)
Estimated private pharmaceutical and biotech clinical trial spending is approximately $75-90 billion annually, representing roughly 90% of global clinical trial spending.
14.
Sinn, M. P. The Political Dysfunction Tax. https://manual.warondisease.org/knowledge/appendix/political-dysfunction-tax.html (2025) doi:10.5281/zenodo.18603840
Quantifying the gap between current global governance and theoretical maximum welfare, estimating a 31-53% efficiency score and $101 trillion in annual opportunity costs.
15.
World Health Organization. Life expectancy at age 60 (years): Global health observatory. (2021).
16.
SIPRI. Global military spending ($2.72T, 2024). SIPRI https://www.sipri.org/publications/2025/sipri-fact-sheets/trends-world-military-expenditure-2024 (2025).
17.
PMC. Only 12% of human interactome targeted. PMC https://pmc.ncbi.nlm.nih.gov/articles/PMC10749231/ (2023)
Mapping 350,000+ clinical trials showed that only 12% of the human interactome has ever been targeted by drugs. Additional sources: https://pmc.ncbi.nlm.nih.gov/articles/PMC10749231/
.18.
Calculated from Orphanet Journal of Rare Diseases (2024). Diseases getting first effective treatment each year. Calculated from Orphanet Journal of Rare Diseases (2024) https://ojrd.biomedcentral.com/articles/10.1186/s13023-024-03398-1 (2024)
Under the current system, approximately 10-15 diseases per year receive their FIRST effective treatment. Calculation: 5% of 7,000 rare diseases ( 350) have FDA-approved treatment, accumulated over 40 years of the Orphan Drug Act = 9 rare diseases/year. Adding 5-10 non-rare diseases that get first treatments yields 10-20 total. FDA approves 50 drugs/year, but many are for diseases that already have treatments (me-too drugs, second-line therapies). Only 15 represent truly FIRST treatments for previously untreatable conditions.
19.
PMC. Standard medical research ROI ($20k-$100k/QALY). PMC: Cost-effectiveness Thresholds Used by Study Authors https://pmc.ncbi.nlm.nih.gov/articles/PMC10114019/ (1990)
Typical cost-effectiveness thresholds for medical interventions in rich countries range from $50,000 to $150,000 per QALY. The Institute for Clinical and Economic Review (ICER) uses a $100,000-$150,000/QALY threshold for value-based pricing. Between 1990-2021, authors increasingly cited $100,000 (47% by 2020-21) or $150,000 (24% by 2020-21) per QALY as benchmarks for cost-effectiveness. Additional sources: https://pmc.ncbi.nlm.nih.gov/articles/PMC10114019/ | https://icer.org/our-approach/methods-process/cost-effectiveness-the-qaly-and-the-evlyg/
.20.
Tufts CSDD. Cost of drug development.
Various estimates suggest $1.0 - $2.5 billion to bring a new drug from discovery through FDA approval, spread across 10 years. Tufts Center for the Study of Drug Development often cited for $1.0 - $2.6 billion/drug. Industry reports (IQVIA, Deloitte) also highlight $2+ billion figures.
21.
Lichtenberg, F. R. How many life-years have new drugs saved? A three-way fixed-effects analysis of 66 diseases in 27 countries, 2000-2013. International Health 11, 403–416 (2019)
Using 3-way fixed-effects methodology (disease-country-year) across 66 diseases in 22 countries, this study estimates that drugs launched after 1981 saved 148.7 million life-years in 2013 alone. The regression coefficients for drug launches 0-11 years prior (beta=-0.031, SE=0.008) and 12+ years prior (beta=-0.057, SE=0.013) on years of life lost are highly significant (p<0.0001). Confidence interval for life-years saved: 79.4M-239.8M (95 percent CI) based on propagated standard errors from Table 2.
22.
Nature Reviews Drug Discovery. Drug trial success rate from phase i to approval. Nature Reviews Drug Discovery: Clinical Success Rates https://www.nature.com/articles/nrd.2016.136 (2016)
Overall Phase I to approval: 10-12.8% (conventional wisdom 10%, studies show 12.8%) Recent decline: Average LOA now 6.7% for Phase I (2014-2023 data) Leading pharma companies: 14.3% average LOA (range 8-23%) Varies by therapeutic area: Oncology 3.4%, CNS/cardiovascular lowest at Phase III Phase-specific success: Phase I 47-54%, Phase II 28-34%, Phase III 55-70% Note: 12% figure accurate for historical average. Recent data shows decline to 6.7%, with Phase II as primary attrition point (28% success) Additional sources: https://www.nature.com/articles/nrd.2016.136 | https://pmc.ncbi.nlm.nih.gov/articles/PMC6409418/ | https://academic.oup.com/biostatistics/article/20/2/273/4817524
.23.
Research and Markets. Global clinical trials market 2024. Research and Markets https://www.globenewswire.com/news-release/2024/04/19/2866012/0/en/Global-Clinical-Trials-Market-Research-Report-2024-An-83-16-Billion-Market-by-2030-AI-Machine-Learning-and-Blockchain-will-Transform-the-Clinical-Trials-Landscape.html (2024)
Global clinical trials market valued at approximately $83 billion in 2024, with projections to reach $83-132 billion by 2030. Additional sources: https://www.globenewswire.com/news-release/2024/04/19/2866012/0/en/Global-Clinical-Trials-Market-Research-Report-2024-An-83-16-Billion-Market-by-2030-AI-Machine-Learning-and-Blockchain-will-Transform-the-Clinical-Trials-Landscape.html | https://www.precedenceresearch.com/clinical-trials-market
.24.
SofproMed. Phase 3 cost per trial range. SofproMed https://www.sofpromed.com/how-much-does-a-clinical-trial-cost
Phase 3 clinical trials cost between $20 million and $282 million per trial, with significant variation by therapeutic area and trial complexity. Additional sources: https://www.sofpromed.com/how-much-does-a-clinical-trial-cost | https://www.cbo.gov/publication/57126
.25.
Ramsberg, J. & Platt, R. Pragmatic trial cost per patient (median $97). Learning Health Systems https://pmc.ncbi.nlm.nih.gov/articles/PMC6508852/ (2018)
Meta-analysis of 108 embedded pragmatic clinical trials (2006-2016). The median cost per patient was $97 (IQR $19–$478), based on 2015 dollars. 25% of trials cost <$19/patient; 10 trials exceeded $1,000/patient. U.S. studies median $187 vs non-U.S. median $27. Additional sources: https://pmc.ncbi.nlm.nih.gov/articles/PMC6508852/
.26.
Kinch, M. S. & Griesenauer, R. H. Lost medicines: A longer view of the pharmaceutical industry with the potential to reinvigorate discovery. Drug Discovery Today 24, 875–880 (2019)
Research identified 1,600+ medicines available in 1962. The 1950s represented industry high-water mark with >30 new products in five of ten years; this rate would not be replicated until late 1990s. More than half (880) of these medicines were lost following implementation of Kefauver-Harris Amendment. The peak of 1962 would not be seen again until early 21st century. By 2016 number of organizations actively involved in R&D at level not seen since 1914.
27.
Baily, M. N. Pre-1962 drug development costs (baily 1972). Baily (1972) https://samizdathealth.org/wp-content/uploads/2020/12/hlthaff.1.2.6.pdf (1972)
Pre-1962: Average cost per new chemical entity (NCE) was $6.5 million (1980 dollars) Inflation-adjusted to 2024 dollars: $6.5M (1980) ≈ $22.5M (2024), using CPI multiplier of 3.46× Real cost increase (inflation-adjusted): $22.5M (pre-1962) → $2,600M (2024) = 116× increase Note: This represents the most comprehensive academic estimate of pre-1962 drug development costs based on empirical industry data Additional sources: https://samizdathealth.org/wp-content/uploads/2020/12/hlthaff.1.2.6.pdf
.28.
Think by Numbers. Pre-1962 physician-led clinical trials. Think by Numbers: How Many Lives Does FDA Save? https://thinkbynumbers.org/health/how-many-net-lives-does-the-fda-save/ (1966)
Pre-1962: Physicians could report real-world evidence directly 1962 Drug Amendments replaced "premarket notification" with "premarket approval", requiring extensive efficacy testing Impact: New regulatory clampdown reduced new treatment production by 70%; lifespan growth declined from 4 years/decade to 2 years/decade Drug Efficacy Study Implementation (DESI): NAS/NRC evaluated 3,400+ drugs approved 1938-1962 for safety only; reviewed >3,000 products, >16,000 therapeutic claims FDA has had authority to accept real-world evidence since 1962, clarified by 21st Century Cures Act (2016) Note: Specific "144,000 physicians" figure not verified in sources Additional sources: https://thinkbynumbers.org/health/how-many-net-lives-does-the-fda-save/ | https://www.fda.gov/drugs/enforcement-activities-fda/drug-efficacy-study-implementation-desi | http://www.nasonline.org/about-nas/history/archives/collections/des-1966-1969-1.html
.29.
Oren Cass, Manhattan Institute. RECOVERY trial cost per patient. Oren Cass https://manhattan.institute/article/slow-costly-clinical-trials-drag-down-biomedical-breakthroughs (2023)
The RECOVERY trial, for example, cost only about $500 per patient... By contrast, the median per-patient cost of a pivotal trial for a new therapeutic is around $41,000. Additional sources: https://manhattan.institute/article/slow-costly-clinical-trials-drag-down-biomedical-breakthroughs
.30.
NHS England; Águas et al. RECOVERY trial global lives saved ( 1 million). NHS England: 1 Million Lives Saved https://www.england.nhs.uk/2021/03/covid-treatment-developed-in-the-nhs-saves-a-million-lives/ (2021)
Dexamethasone saved 1 million lives worldwide (NHS England estimate, March 2021, 9 months after discovery). UK alone: 22,000 lives saved. Methodology: Águas et al. Nature Communications 2021 estimated 650,000 lives (range: 240,000-1,400,000) for July-December 2020 alone, based on RECOVERY trial mortality reductions (36% for ventilated, 18% for oxygen-only patients) applied to global COVID hospitalizations. June 2020 announcement: Dexamethasone reduced deaths by up to 1/3 (ventilated patients), 1/5 (oxygen patients). Impact immediate: Adopted into standard care globally within hours of announcement. Additional sources: https://www.england.nhs.uk/2021/03/covid-treatment-developed-in-the-nhs-saves-a-million-lives/ | https://www.nature.com/articles/s41467-021-21134-2 | https://pharmaceutical-journal.com/article/news/steroid-has-saved-the-lives-of-one-million-covid-19-patients-worldwide-figures-show | https://www.recoverytrial.net/news/recovery-trial-celebrates-two-year-anniversary-of-life-saving-dexamethasone-result
.31.
Manhattan Institute. RECOVERY trial 82× cost reduction. Manhattan Institute: Slow Costly Trials https://manhattan.institute/article/slow-costly-clinical-trials-drag-down-biomedical-breakthroughs
RECOVERY trial: $500 per patient ($20M for 48,000 patients = $417/patient) Typical clinical trial: $41,000 median per-patient cost Cost reduction: 80-82× cheaper ($41,000 ÷ $500 ≈ 82×) Efficiency: $50 per patient per answer (10 therapeutics tested, 4 effective) Dexamethasone estimated to save >630,000 lives Additional sources: https://manhattan.institute/article/slow-costly-clinical-trials-drag-down-biomedical-breakthroughs | https://pmc.ncbi.nlm.nih.gov/articles/PMC9293394/
.32.
ICER. Value per QALY (standard economic value). ICER https://icer.org/wp-content/uploads/2024/02/Reference-Case-4.3.25.pdf (2024)
Standard economic value per QALY: $100,000–$150,000. This is the US and global standard willingness-to-pay threshold for interventions that add costs. Dominant interventions (those that save money while improving health) are favorable regardless of this threshold. Additional sources: https://icer.org/wp-content/uploads/2024/02/Reference-Case-4.3.25.pdf
.33.
FDA Study via NCBI. Trial costs, FDA study. FDA Study via NCBI https://www.ncbi.nlm.nih.gov/pmc/articles/PMC6248200/
Overall, the 138 clinical trials had an estimated median (IQR) cost of $19.0 million ($12.2 million-$33.1 million)... The clinical trials cost a median (IQR) of $41,117 ($31,802-$82,362) per patient. Additional sources: https://www.ncbi.nlm.nih.gov/pmc/articles/PMC6248200/
.34.
DOT. DOT value of statistical life ($13.6M). DOT: VSL Guidance 2024 https://www.transportation.gov/office-policy/transportation-policy/revised-departmental-guidance-on-valuation-of-a-statistical-life-in-economic-analysis (2024)
Current VSL (2024): $13.7 million (updated from $13.6M) Used in cost-benefit analyses for transportation regulations and infrastructure Methodology updated in 2013 guidance, adjusted annually for inflation and real income VSL represents aggregate willingness to pay for safety improvements that reduce fatalities by one Note: DOT has published VSL guidance periodically since 1993. Current $13.7M reflects 2024 inflation/income adjustments Additional sources: https://www.transportation.gov/office-policy/transportation-policy/revised-departmental-guidance-on-valuation-of-a-statistical-life-in-economic-analysis | https://www.transportation.gov/regulations/economic-values-used-in-analysis
.35.
Sinn, M. P. Right to Trial & FDA Upgrade Act. https://papers.acceleratedmedicine.org/right-to-trial.html (2025) doi:10.5281/zenodo.19076852
A universal right to try, with evidence. The Act authorizes commercial access after initial human safety testing and makes every covered treatment use teach us something.
36.
Montana 69th Legislature. Senate bill no. 535: An act revising laws related to experimental treatments. (2025).
37.
Montana Department of Public Health and Human Services. Notice of adoption: MAR notice no. 2026-427.2, new rules 1 through 25 pertaining to experimental treatment centers. (2026).
38.
Molteni, M. As billionaires race to fund anti-aging projects, a much-discussed trial goes overlooked. STAT https://www.statnews.com/2022/08/09/anti-aging-projects-funding-much-discussed-trial-overlooked/ (2022).
39.
U.S. Food and Drug Administration. Right to try.
40.
U.S. Food and Drug Administration. Demonstrating substantial evidence of effectiveness for human drug and biological products. (2026).
41.
U.S. Food and Drug Administration. Integrating randomized controlled trials for drug and biological products into routine clinical practice: Draft guidance for industry. (2024).
42.
U.S. Food and Drug Administration. Project pragmatica. (2025).
43.
U.S. Food and Drug Administration. Charging for investigational drugs under an IND: Questions and answers. (2024).
44.
Centers for Medicare & Medicaid Services. Medicare coverage with evidence development. (2024).
45.
Sinn, M. P. The Continuous Evidence Generation Protocol: Two-Stage Validation (RWE → Pragmatic Trials). https://papers.acceleratedmedicine.org/dfda-protocol.html (2025) doi:10.5281/zenodo.18203375
We present the Predictor Impact Score (PIS), a novel composite metric operationalizing Bradford Hill causality criteria for automated signal detection from aggregated N-of-1 observational studies. Combined with pragmatic trial confirmation (based on evidence from 108+ embedded trials), this two-stage framework would generate validated outcome labels at 44.1x lower cost than traditional Phase III trials. This enables continuous, population-scale pharmacovigilance and precision dosing recommendations.
46.
Infinita. Bridging the gap from biotech to clinic. (2026).
47.
Goldwater Institute. Alaska becomes 41st state to enact right to try legislation. (2018).
Reuse
Copyright
© 2025 Mike P. Sinn