Opening requested calculation...
Please wait, this takes like 47 seconds. Thank you for your patience! :)
☠
0 humans have been terminated by curable diseases since this page started loading
The Short Version
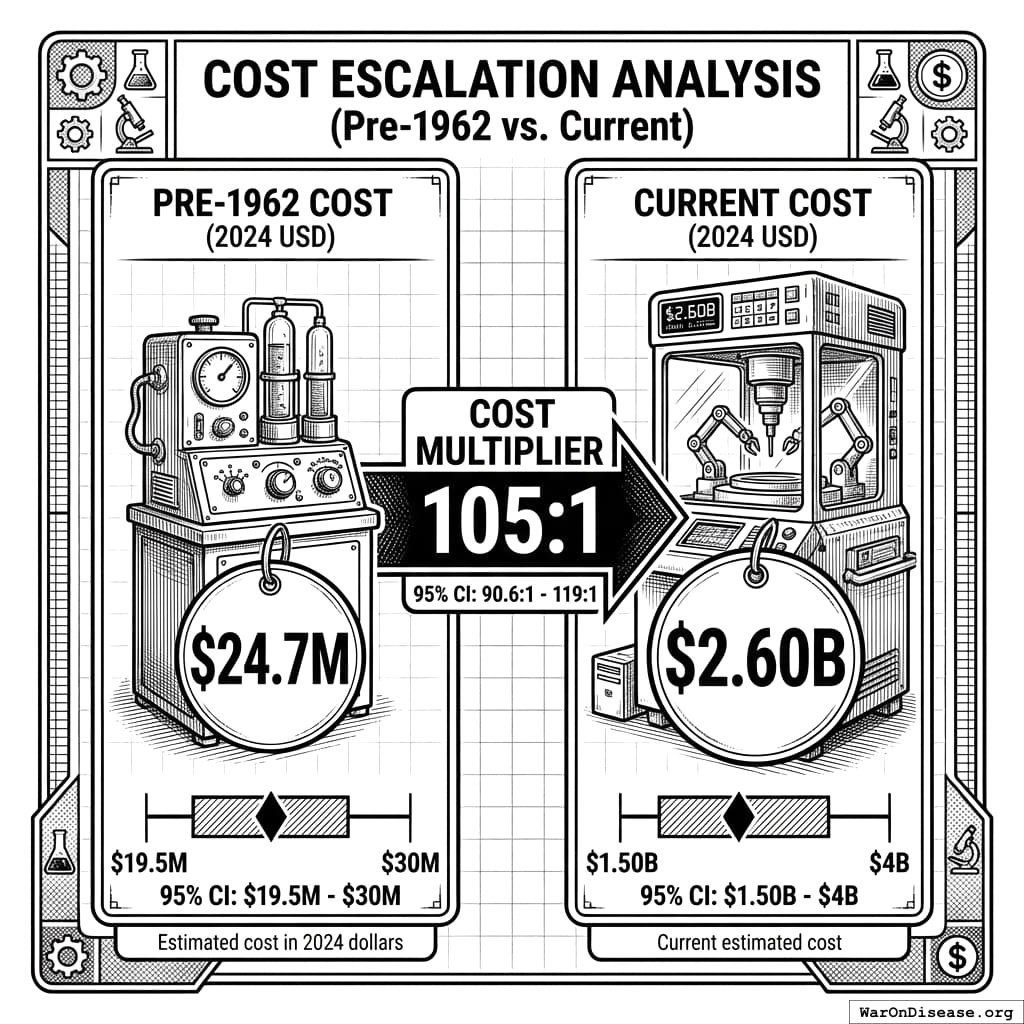
In 1960, developing a new drug cost $24.7 million (95% CI: $19.5 million-$30 million) in today’s dollars. Now it costs $2.6 billion (95% CI: $1.5 billion-$4 billion). That is 105x (90% CI: 72.8x-149x) more. Adjusted for inflation. Using real academic data (Baily 1972). The drugs are not 105x (90% CI: 72.8x-149x) better.
Four things drove this:
- Timelines exploded. 2-3 years became 10-15 years. The drug does not take longer to invent. The paperwork takes longer to complete.
- Failure rates climbed. More capital at risk per approved drug.
- Regulations multiplied. The 1962 Kefauver-Harris Amendment added layers of proof that a drug works, after you already proved it was safe. The layers have been adding layers ever since.
- Trial costs ballooned. Cost per patient increased by 82x (90% CI: 21.4x-195x). The patient is not 82x (90% CI: 21.4x-195x) sicker.
Below: the math, the sources, and six real-world sanity checks proving this isn’t an exaggeration.
Historical Data Sources
Pre-1962 Drug Development Costs
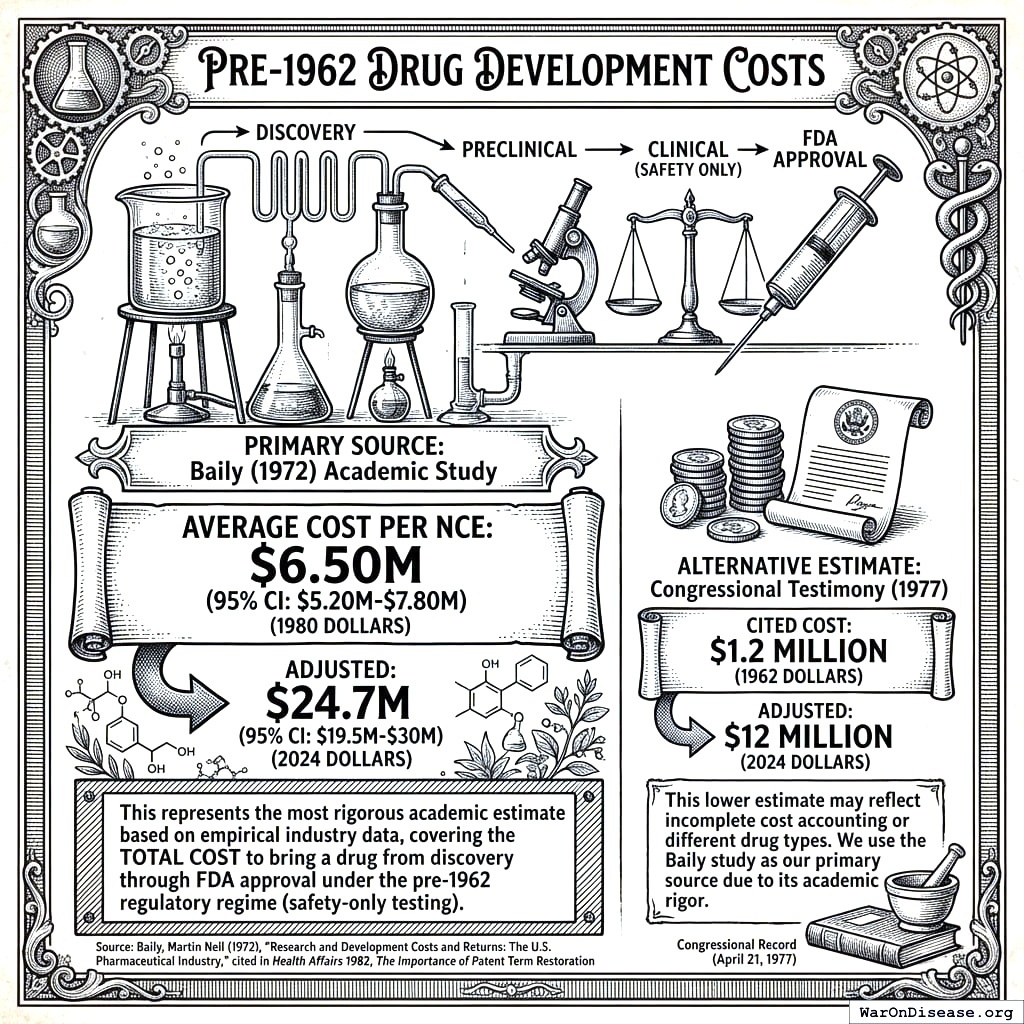
Primary Source: Baily (1972) Academic Study
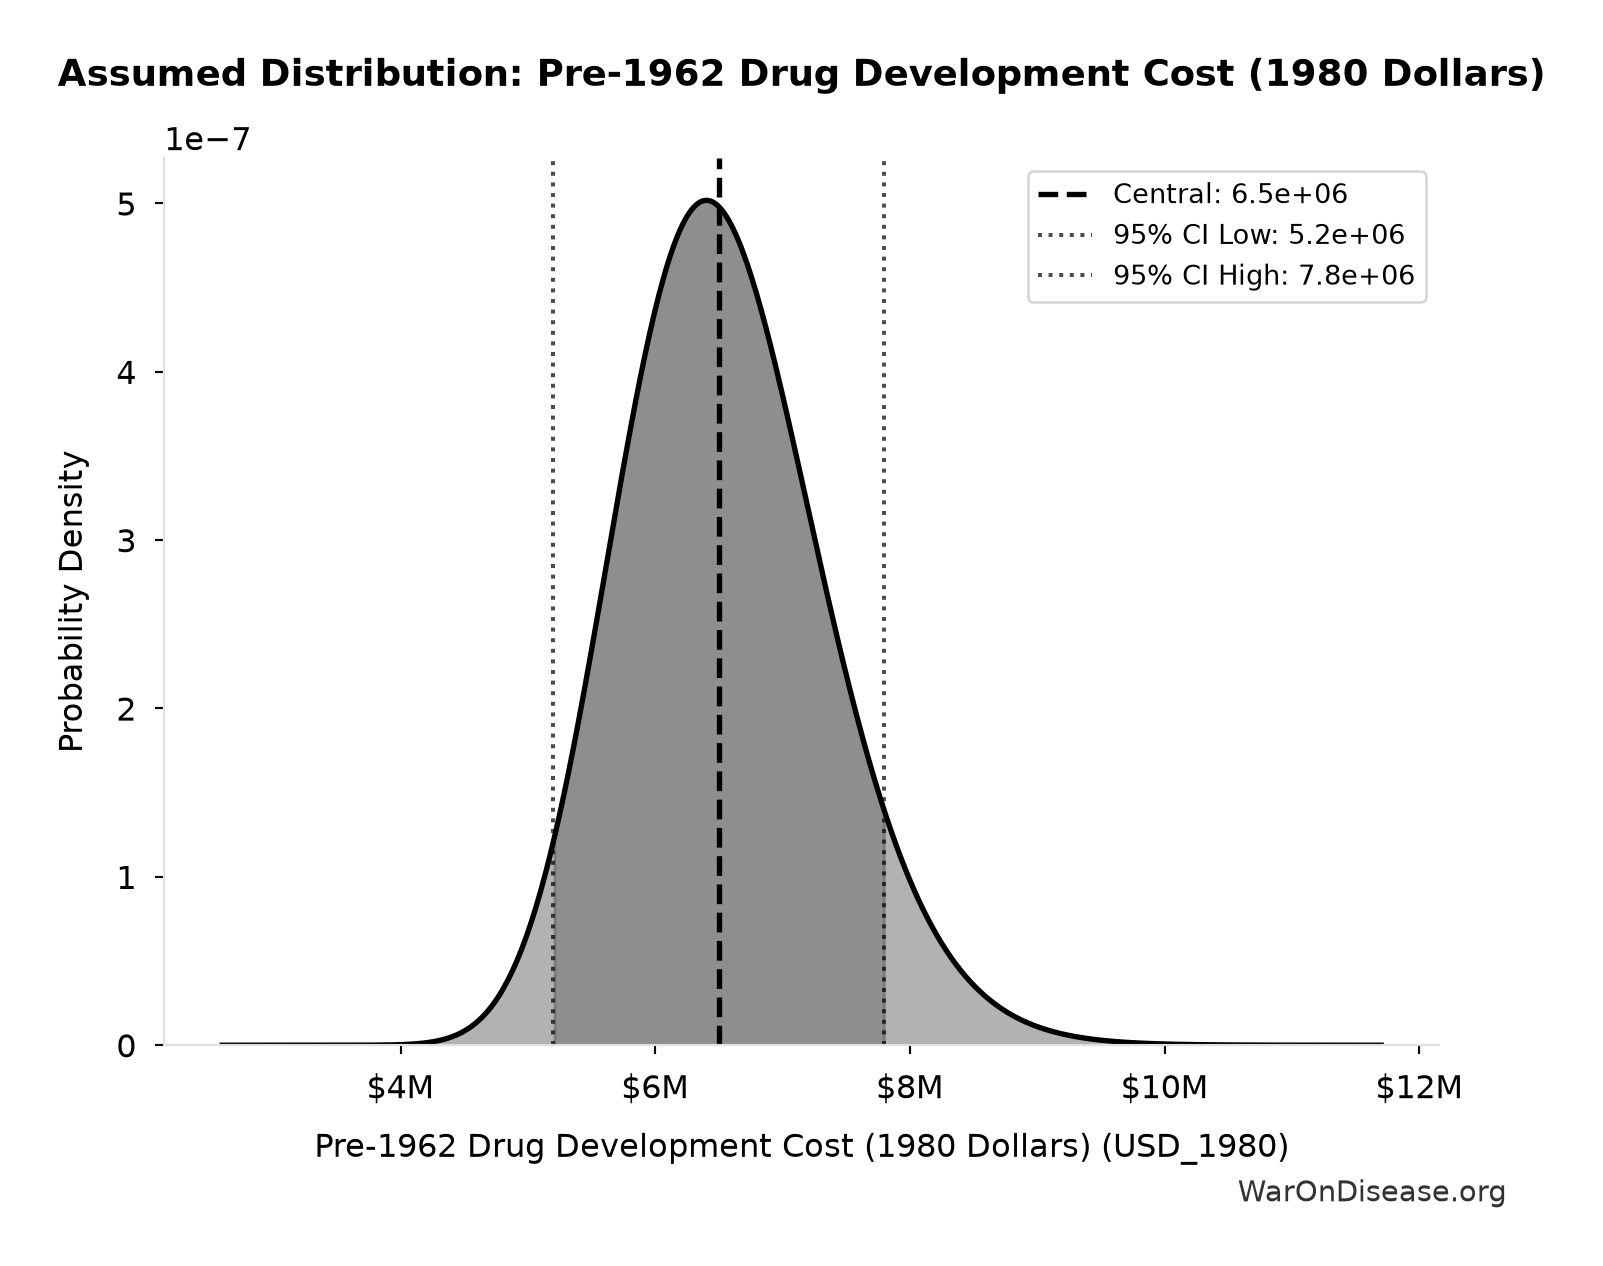
The average cost per new chemical entity (NCE) in the pre-1962 era was $6.5 million (95% CI: $5.2 million-$7.8 million) (1980 dollars), which adjusts to $24.7 million (95% CI: $19.5 million-$30 million) (2024 dollars).
Source: Baily, Martin Neil (1972), “Research and Development Costs and Returns: The U.S. Pharmaceutical Industry,” cited in Health Affairs 1982, The Importance of Patent Term Restoration27
This covers the total cost to bring a drug from discovery through FDA approval under the pre-1962 regime (safety-only testing). It’s the best academic estimate available.
Alternative: Congressional Testimony (1977)
Congress cited $1.2 million (1962 dollars) = $12 million (2024 dollars). Lower than Baily, probably due to incomplete cost accounting. The Baily study is more thorough.
Current Drug Development Costs
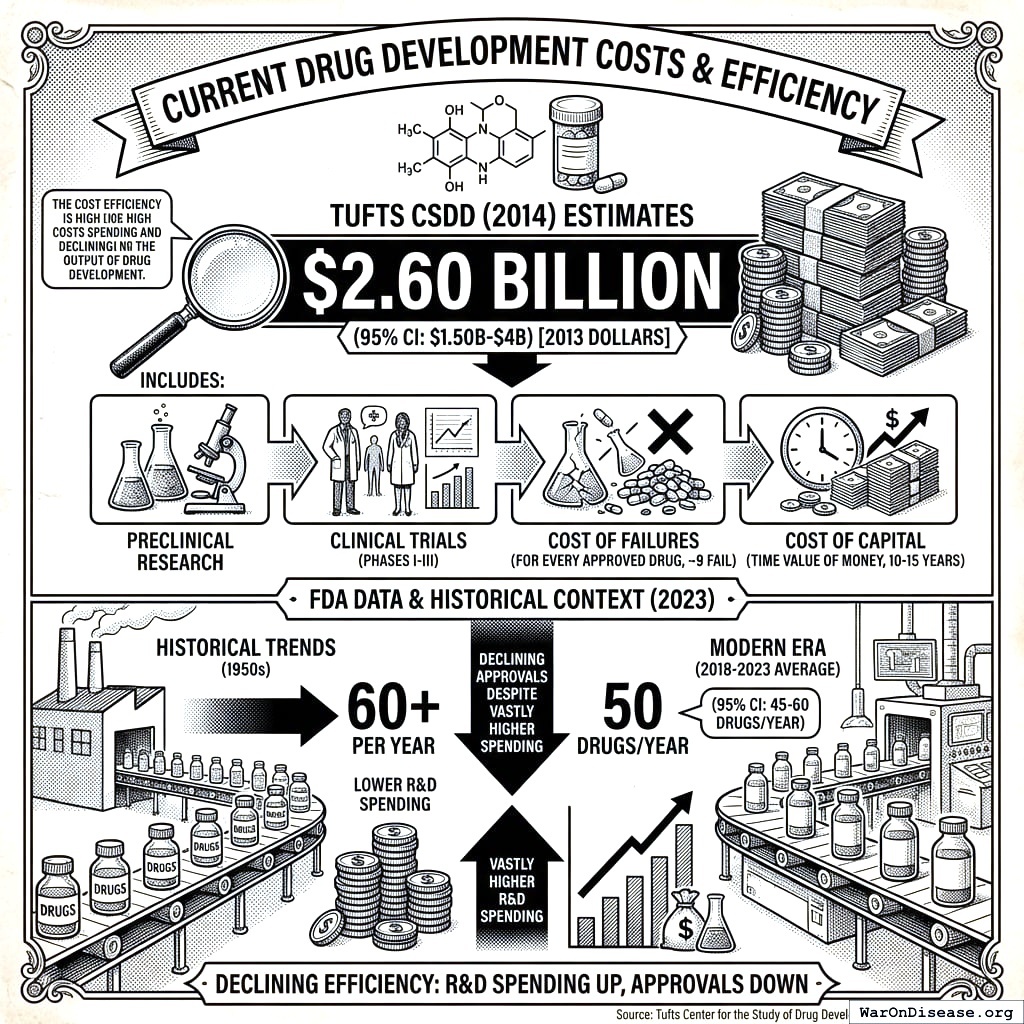
Tufts CSDD (2014):
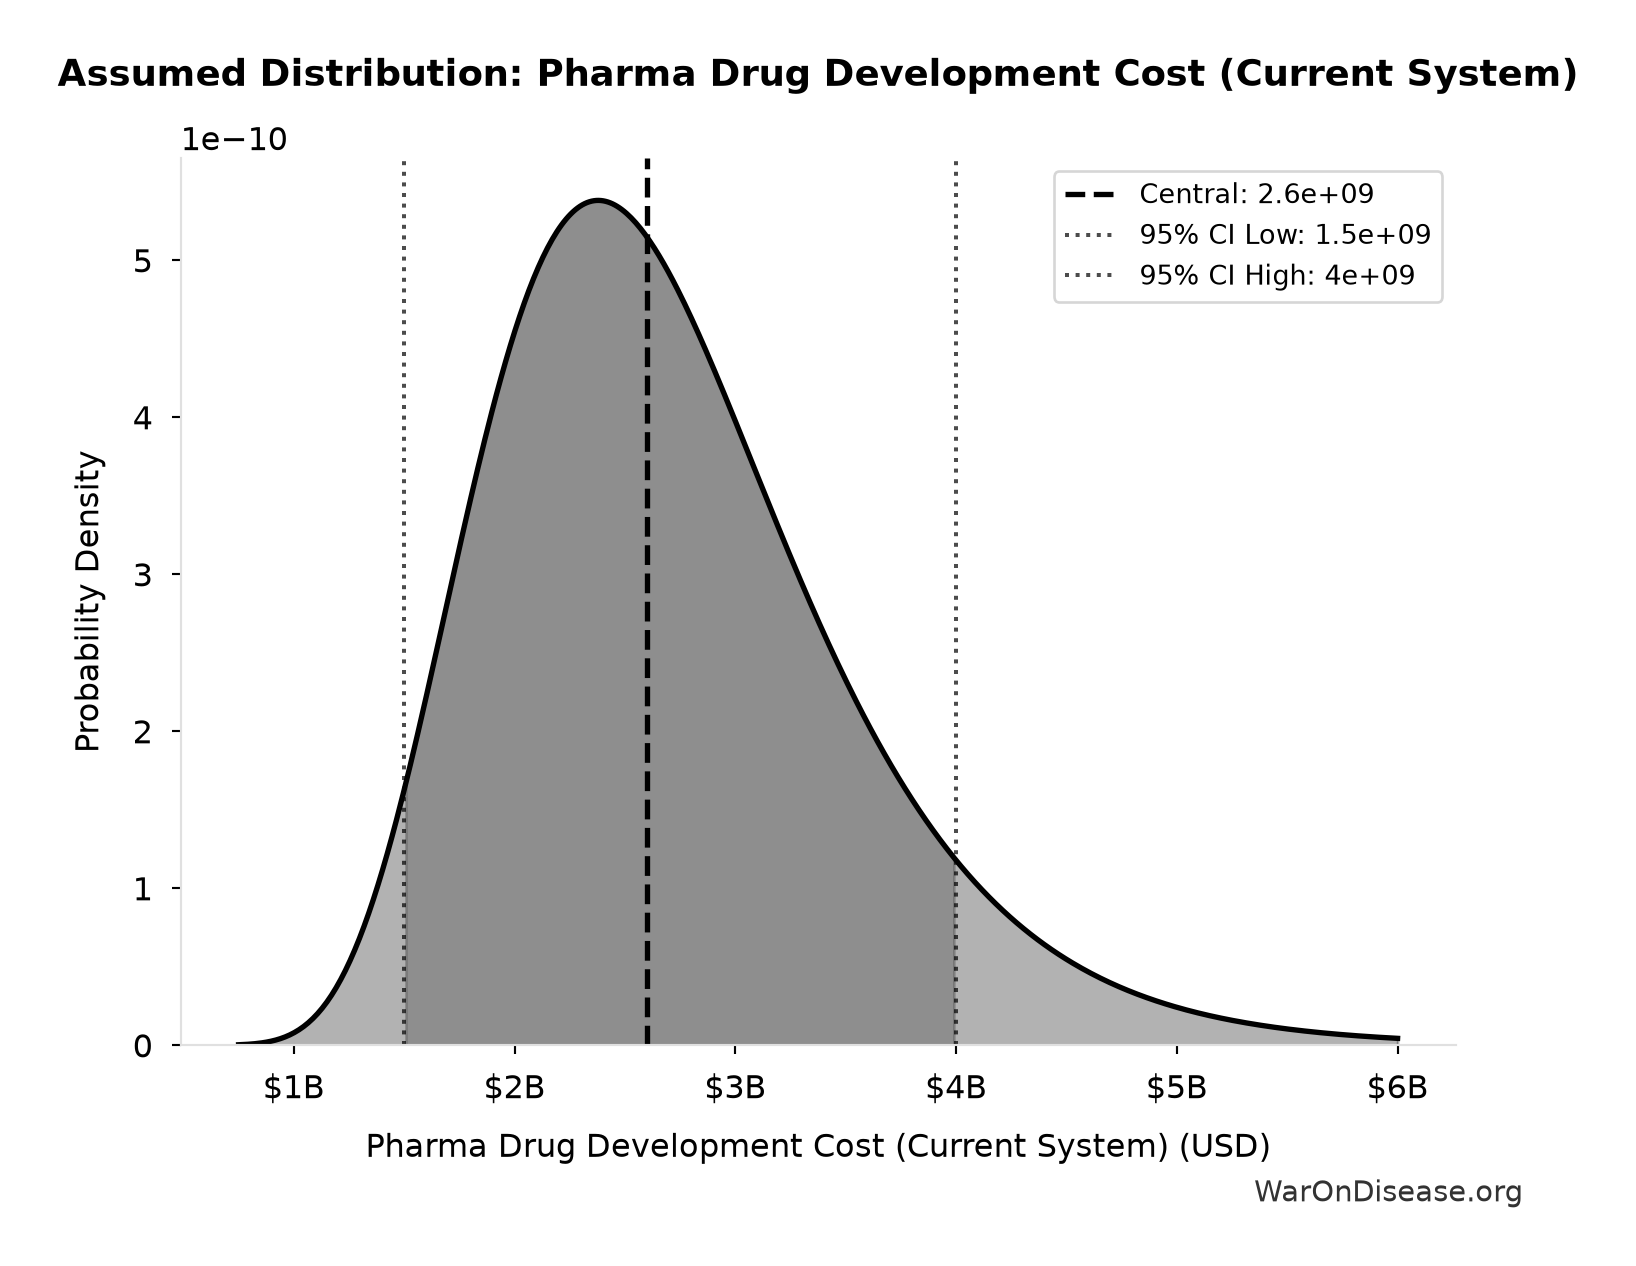
The average cost to develop and gain approval for a new drug is $2.6 billion (95% CI: $1.5 billion-$4 billion) (2013 dollars).
Source: Tufts Center for the Study of Drug Development, 2014
This includes:
- Preclinical research
- Clinical trials (Phases I-III)
- Cost of failures (for every approved drug, ~9 fail)
- Cost of capital (time value of money over 10-15 years)
FDA Data (2023):
FDA approved 50 drugs/year (95% CI: 45 drugs/year-60 drugs/year) new drugs per year (2018-2023 average), down from 60+ per year in the 1950s, despite vastly higher R&D spending.
Inflation-Adjusted Calculations
Primary Method: Baily (1972) Academic Study
Step 1: Adjust 1980 dollars to 2024 dollars
\[
\text{Pre-1962 cost in 2024 dollars} = \$6.5M \times \text{CPI multiplier}_{1980 \to 2024}
\]
Using the Bureau of Labor Statistics CPI calculator5:
\[
\$6.5M \times 3.80 = \$24.7M
\]
Therefore, the pre-1962 drug development cost in 2024 dollars is $24.7 million (95% CI: $19.5 million-$30 million).
Step 2: Calculate real cost increase
\[
\begin{gathered}
k_{cost,pre62} \\
= \frac{Cost_{dev,curr}}{Cost_{pre62,24}} \\
= \frac{\$2.6B}{\$24.7M} \\
= 105
\end{gathered}
\]
Alternative Method: Congressional Testimony (1977)
Step 1: Adjust 1962 dollars to 2024 dollars
- $1.2M (1962 dollars)
- CPI multiplier (1962 → 2024): 10.13×
- $1.2M × 10.13 = $12.2M (2024 dollars)
Step 2: Calculate real cost increase
\[
\text{Cost multiplier} = \frac{\$2.6B}{\$12.2M} = 213\text{×}
\]
Upper-bound estimate: 213x. The Baily study (105x (90% CI: 72.8x-149x)) is used here because it’s more rigorous.
Why Inflation Doesn’t Explain This
The 105x (90% CI: 72.8x-149x) increase comes from four things stacking on top of each other:
Development Timeline Expansion
| Pre-1962 |
2-3 years |
Minimal |
| Post-1962 |
10-15 years |
Massive (compounding at cost of capital) |
Cost of capital impact: $100M invested for 12 years at pharma’s 10% hurdle rate:
\[
\text{Present value cost} = \$100M \times (1.10)^{12} = \$314M
\]
A 12-year delay adds 3.14× to costs via time value of money alone.
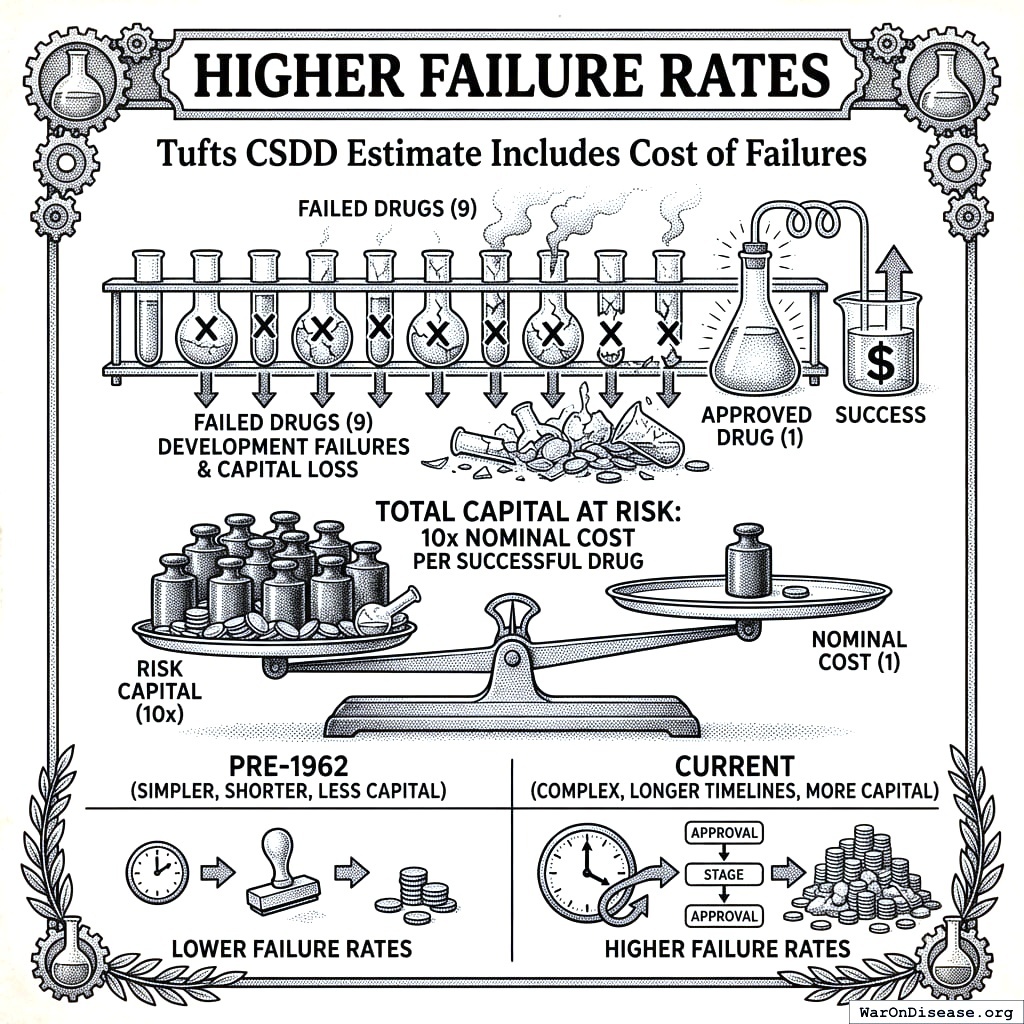
Higher Failure Rates
The Tufts CSDD figure includes cost of failures:
- For every drug that gets approved, 9 fail
- Total capital at risk: 10x the nominal cost per success
- Pre-1962 failure rates were lower. Simpler approval, shorter timelines, less money on fire.
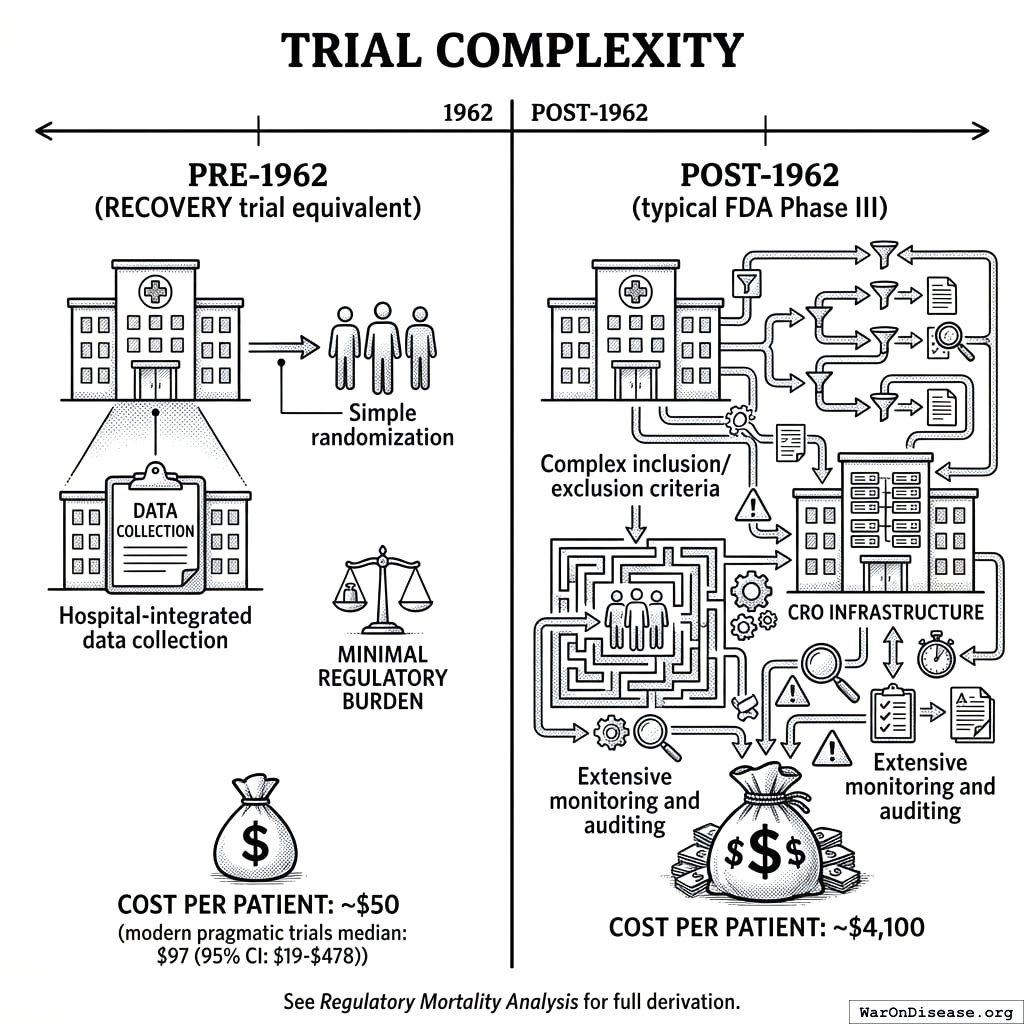
Trial Complexity
Pre-1962 (RECOVERY trial equivalent):
- Simple randomization
- Hospital-integrated data collection
- Minimal regulatory burden
- Cost per patient: ~$50 (modern pragmatic trials median: $97 (95% CI: $19-$478)25)
Post-1962 (typical FDA Phase III):
- Complex inclusion/exclusion criteria
- Separate CRO infrastructure
- Extensive monitoring and auditing
- Cost per patient: ~$4,100
See Regulatory Mortality Analysis for full derivation.
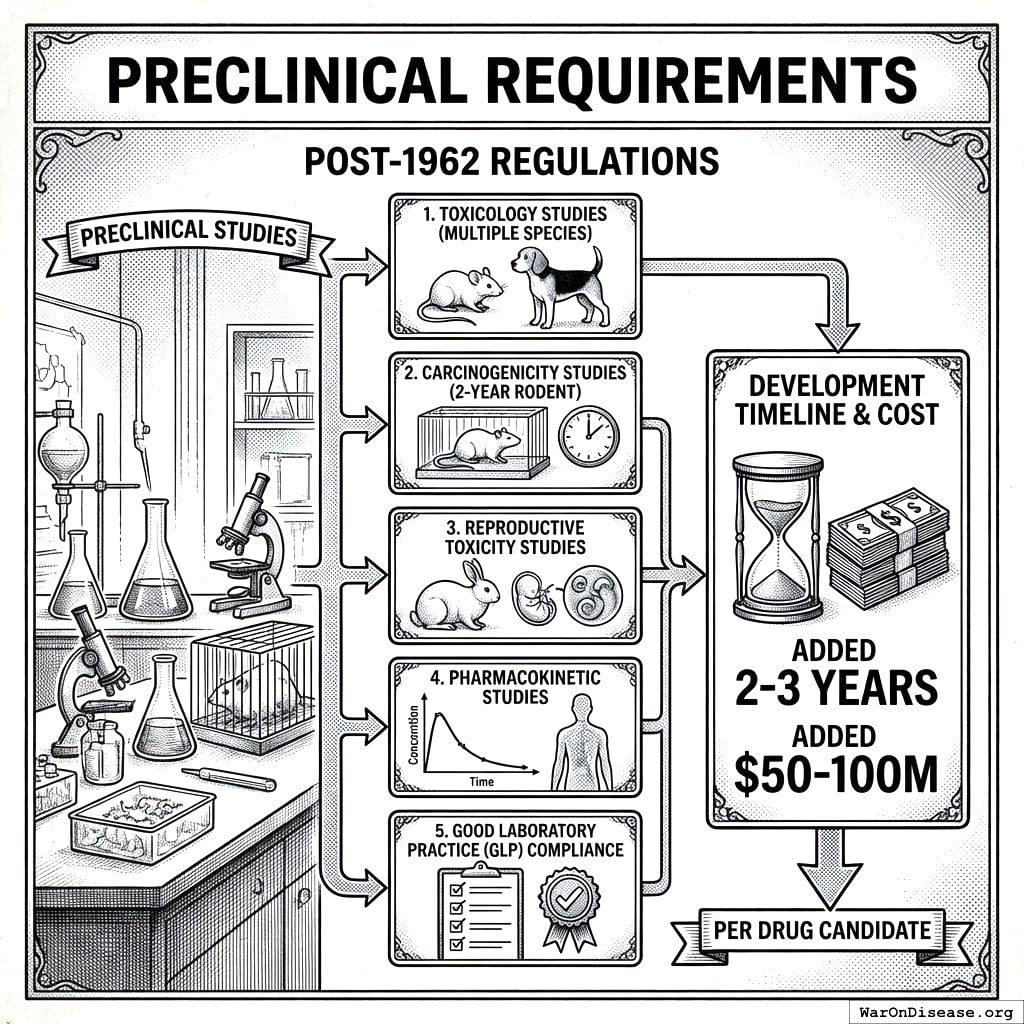
Preclinical Requirements
Post-1962 regulations added years of preclinical work before you can touch a human:
- Toxicology studies (multiple species)
- Carcinogenicity studies (2-year rodent studies)
- Reproductive toxicity studies
- Pharmacokinetic studies
- Good Laboratory Practice (GLP) compliance
These requirements added 2-3 years and $50-100M per drug candidate.
How Solid Is This Number?
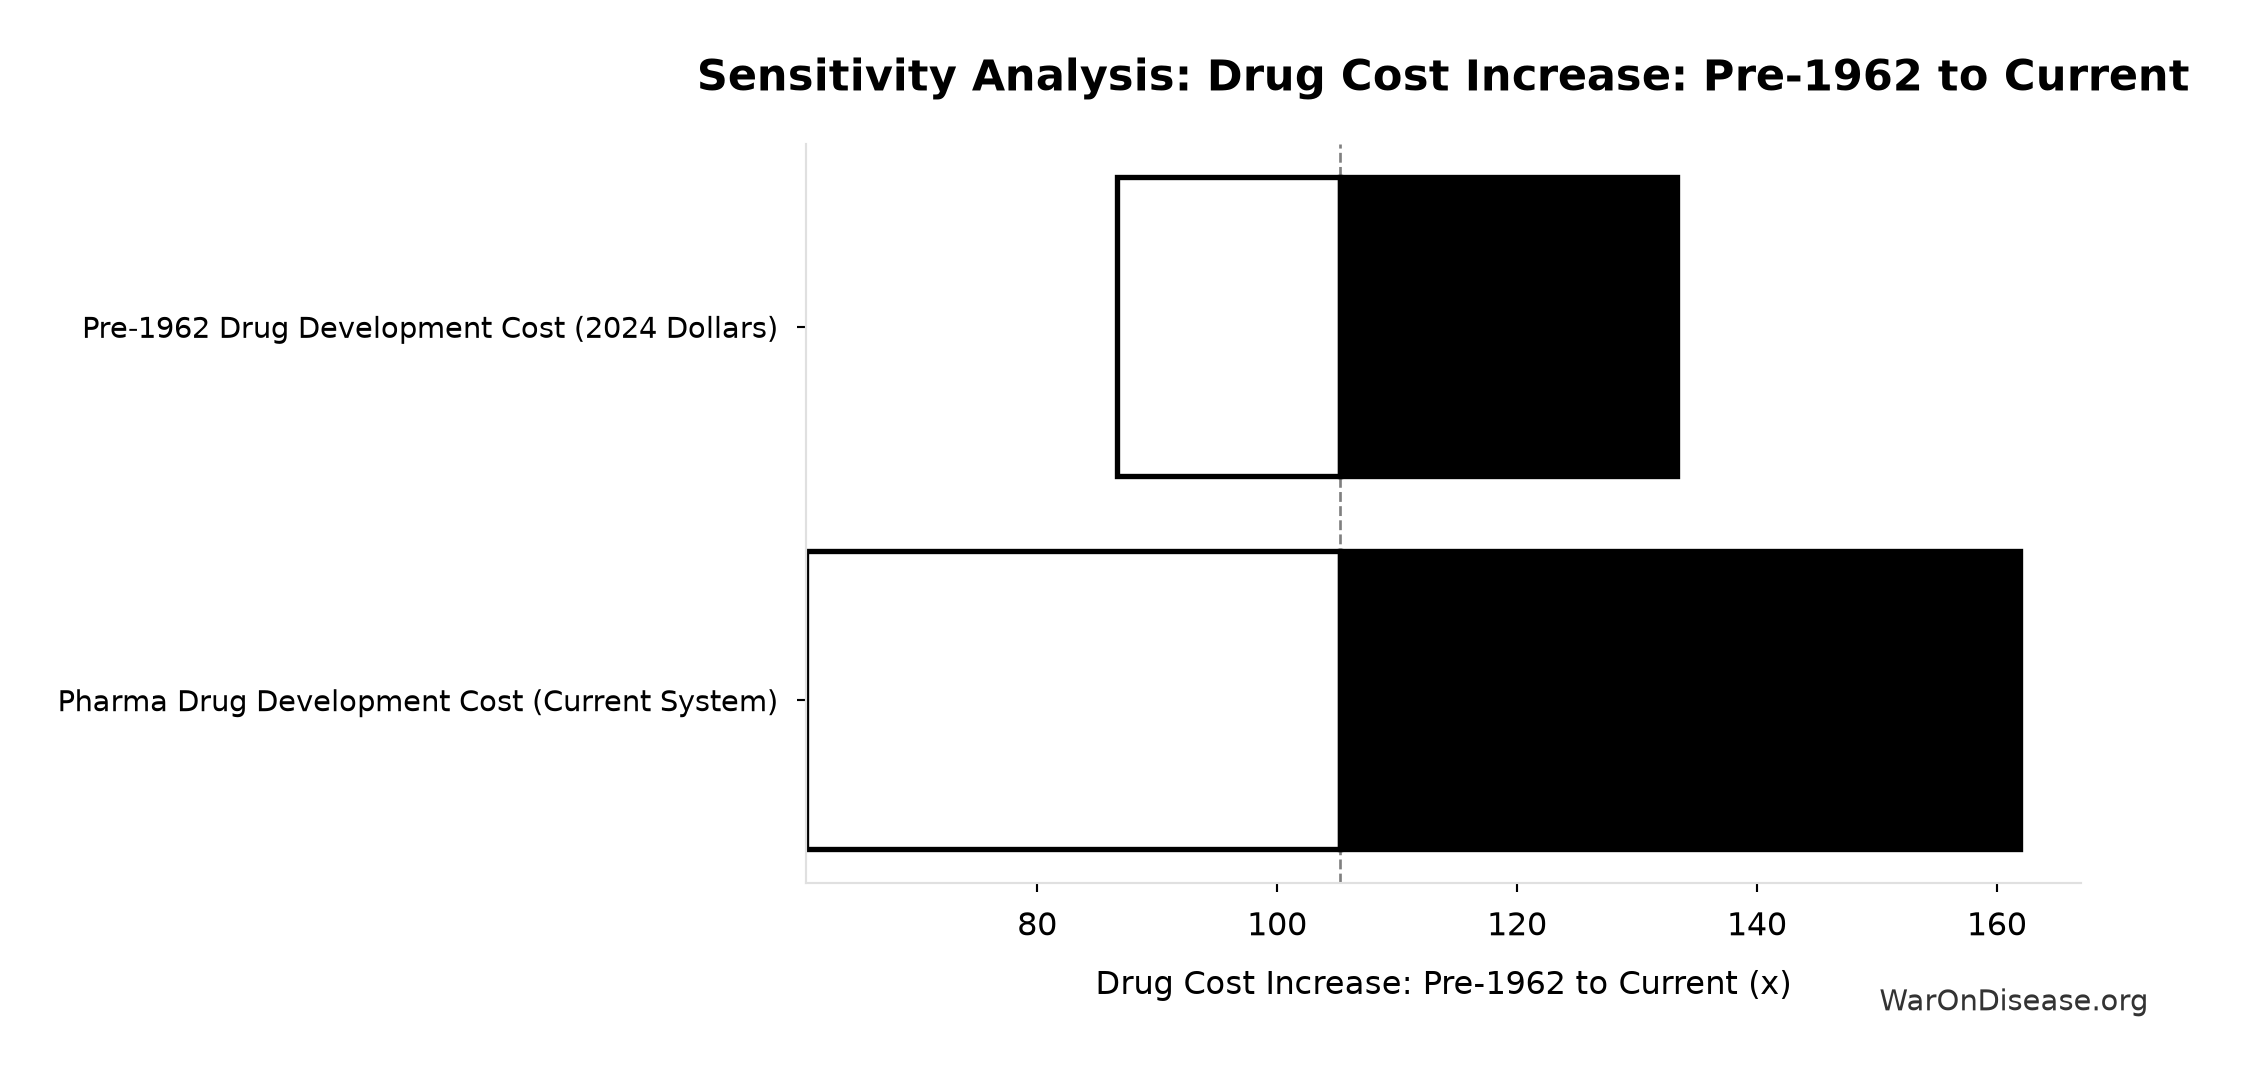
The 105x (90% CI: 72.8x-149x) multiplier depends on three inputs:
- Pre-1962 cost ($6.5M in 1980 dollars, Baily 1972)
- CPI multiplier (1980 to 2024)
- Current cost ($2.6B in 2013 dollars, Tufts CSDD)
Full Range of Outcomes
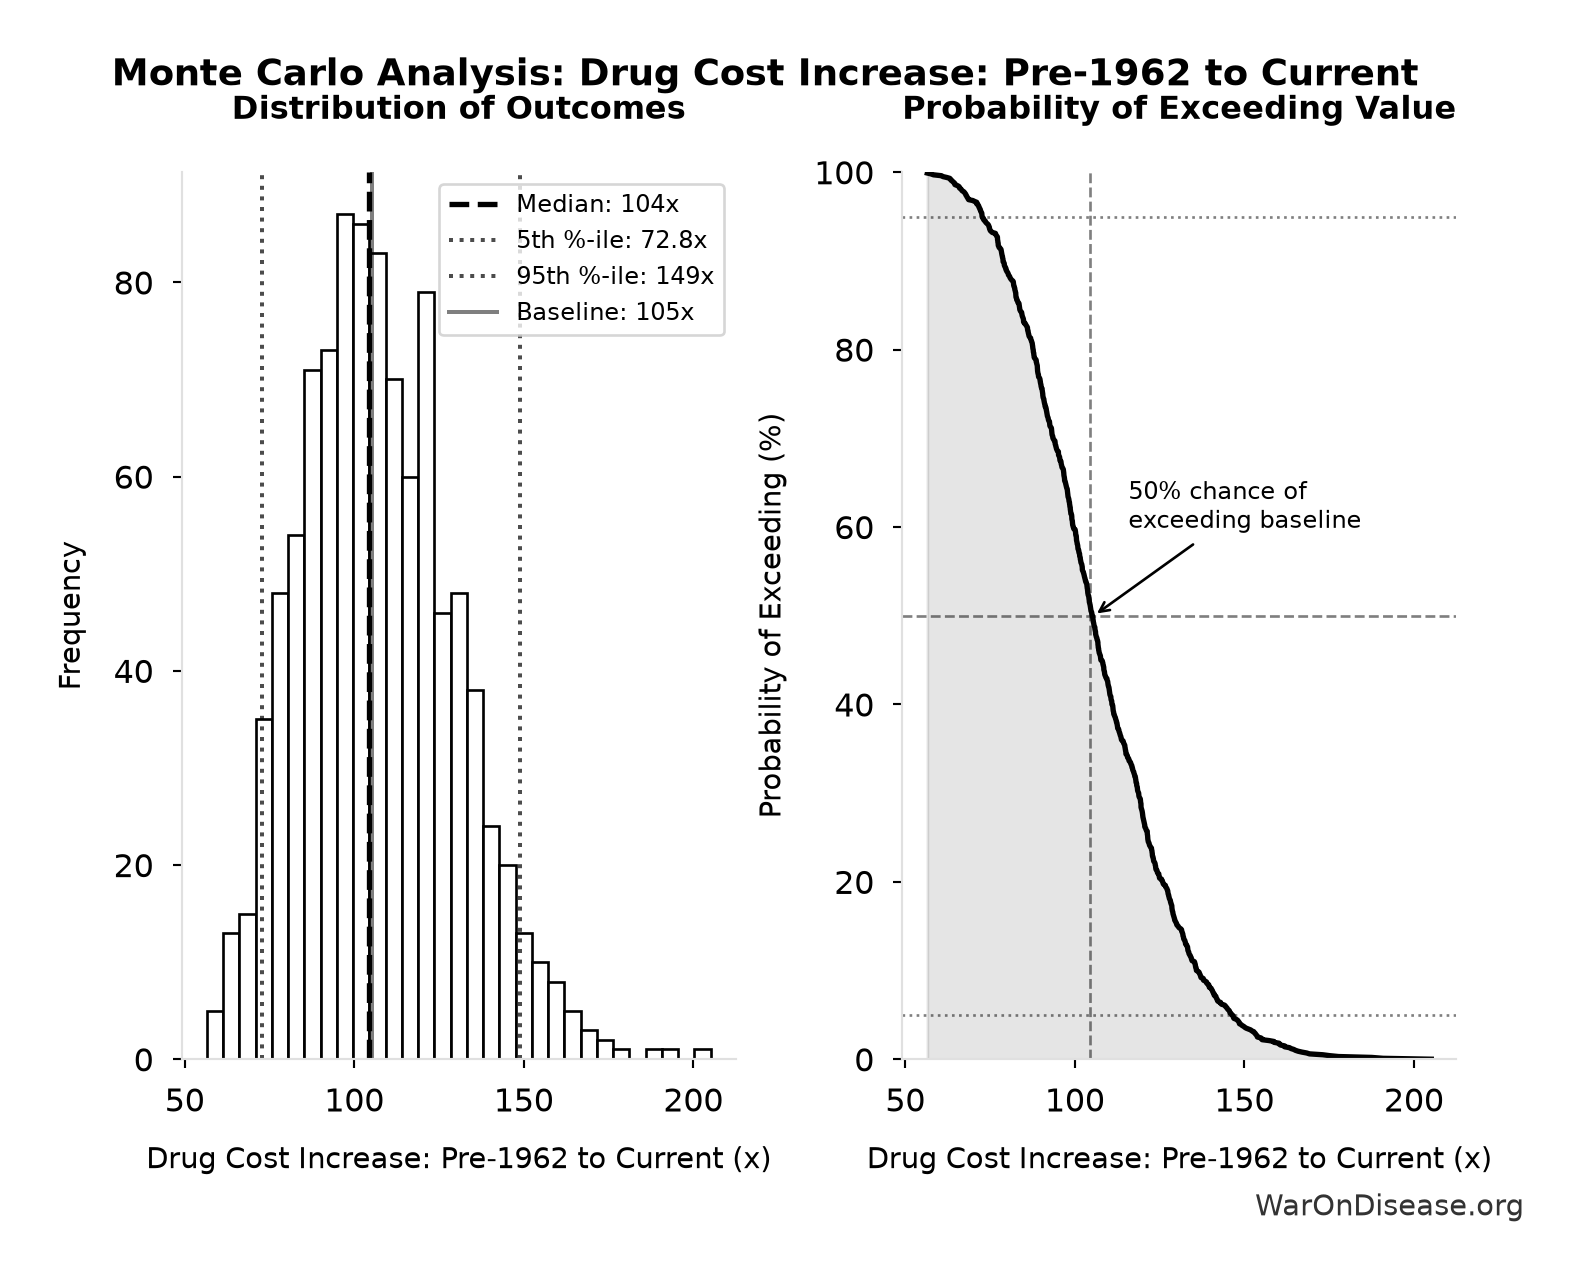
Simulation Results Summary: Drug Cost Increase: Pre-1962 to Current
| Baseline (deterministic) |
105x |
| Mean (expected value) |
107x |
| Median (50th percentile) |
104x |
| Standard Deviation |
22.9x |
| 90% Range (5th-95th percentile) |
[72.8x, 149x] |
The histogram shows 1,000 of the 10,000 Monte Carlo draws for Drug Cost Increase: Pre-1962 to Current; the summary statistics use all 10,000. The exceedance curve (right) shows the probability of the outcome exceeding any given value.
10,000 Monte Carlo runs. Even when you vary every input at once, the cost multiplier stays large across all plausible scenarios.
Independent Validation
Other researchers found the same thing:
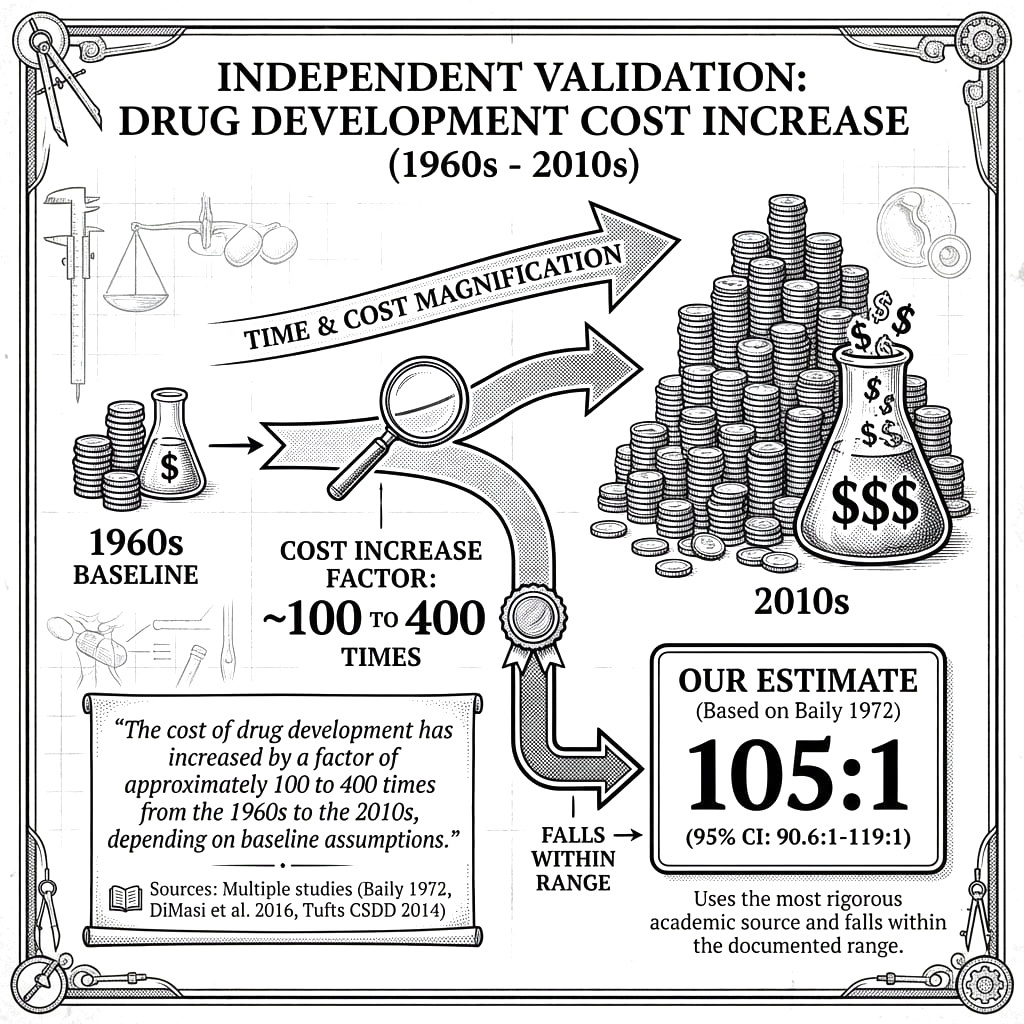
“The cost of drug development has increased by a factor of approximately 100 to 400 times from the 1960s to the 2010s, depending on baseline assumptions.”
Sources: Multiple studies (Baily 197227, DiMasi et al. 201635, Tufts CSDD 201436)
The 105x (90% CI: 72.8x-149x) estimate falls right in the middle of the documented range.
Sanity Checks: Real-World Price Comparisons
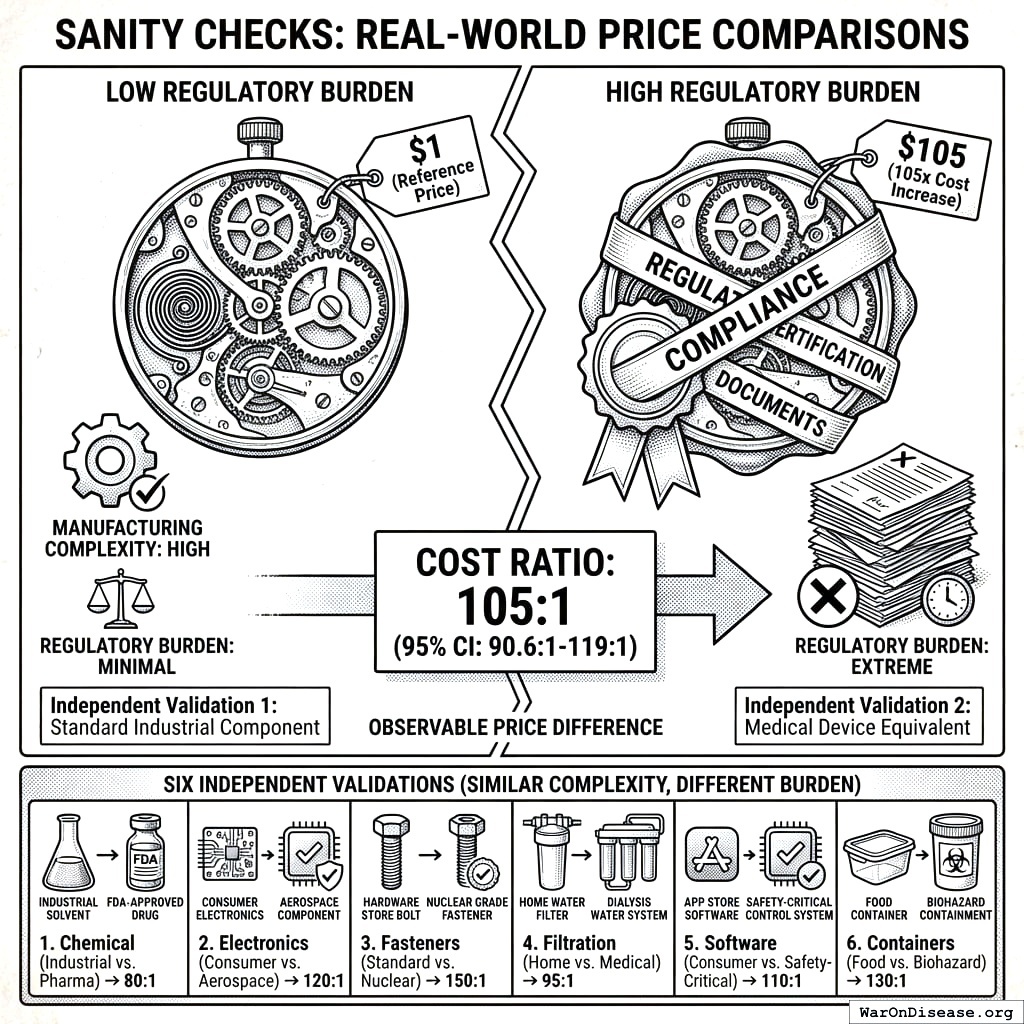
If drugs really cost 105x (90% CI: 72.8x-149x) more to develop, you should see price gaps between products that are identical to make but face different regulatory burdens. You do. Six times over:
Generic vs. Brand-Name Drugs (Patent Cliff Evidence)
When a drug’s patent expires and generic manufacturers enter the market, prices typically drop 80-90% within the first year37.
Example: Lipitor (atorvastatin)
- Brand-name price (under patent): ~$175/month
- Generic price (post-patent): ~$10-20/month
- Price drop: 89-94%
What this tells you: If manufacturing drove pricing, generics would be 10-20% cheaper. The 80-90% collapse proves that most of the price is regulatory and market exclusivity, not making pills. The cost to get approval dwarfs the cost to make the pills.
Nutritional Supplements vs. Prescription Drugs (Same Molecule, Different Regulation)
Same molecule. Same capsule. Different label. Different price:
| Vitamin D |
$0.05-0.10 per 1000 IU |
$1.50-3.00 per 1000 IU (prescription D2) |
15-60× |
| Fish Oil (Omega-3) |
$0.20-0.40 per gram EPA/DHA |
$3-4 per gram (Lovaza prescription) |
8-20× |
| Niacin |
$0.05 per 500mg |
$2-5 per 500mg (Niaspan prescription) |
40-100× |
| Melatonin |
$0.10 per 3mg |
Not available as prescription in US |
N/A |
Same equipment. Same capsules. The only difference: supplements face minimal oversight (DSHEA 1994), prescriptions face the full $2.6B FDA process.
Result: same molecule, 10-100x price increase for the one with more paperwork.
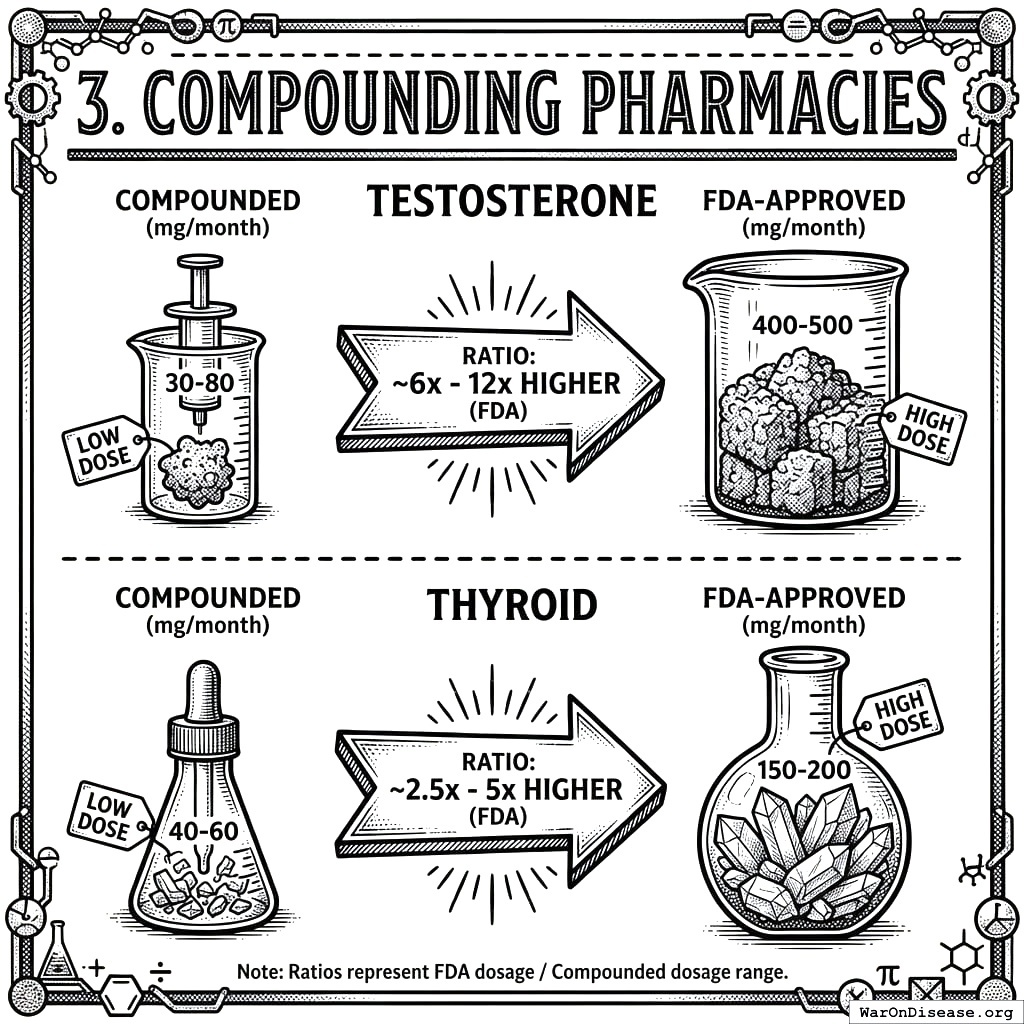
Compounding Pharmacies (Custom Manufacturing Without FDA Approval)
Compounding pharmacies make custom medications without the full FDA gauntlet. Their prices reveal what drugs actually cost to make:
Example: Testosterone replacement
- Compounded testosterone cream: $30-80/month
- FDA-approved AndroGel: $400-500/month
- Price ratio: 5-17×
Example: Thyroid medication
- Compounded T3/T4 combo: $40-60/month
- FDA-approved Synthroid + Cytomel: $150-200/month
- Price ratio: 2-5×
They still have quality control. They just skip the multi-billion-dollar approval process. Their prices are what drugs actually cost to make.
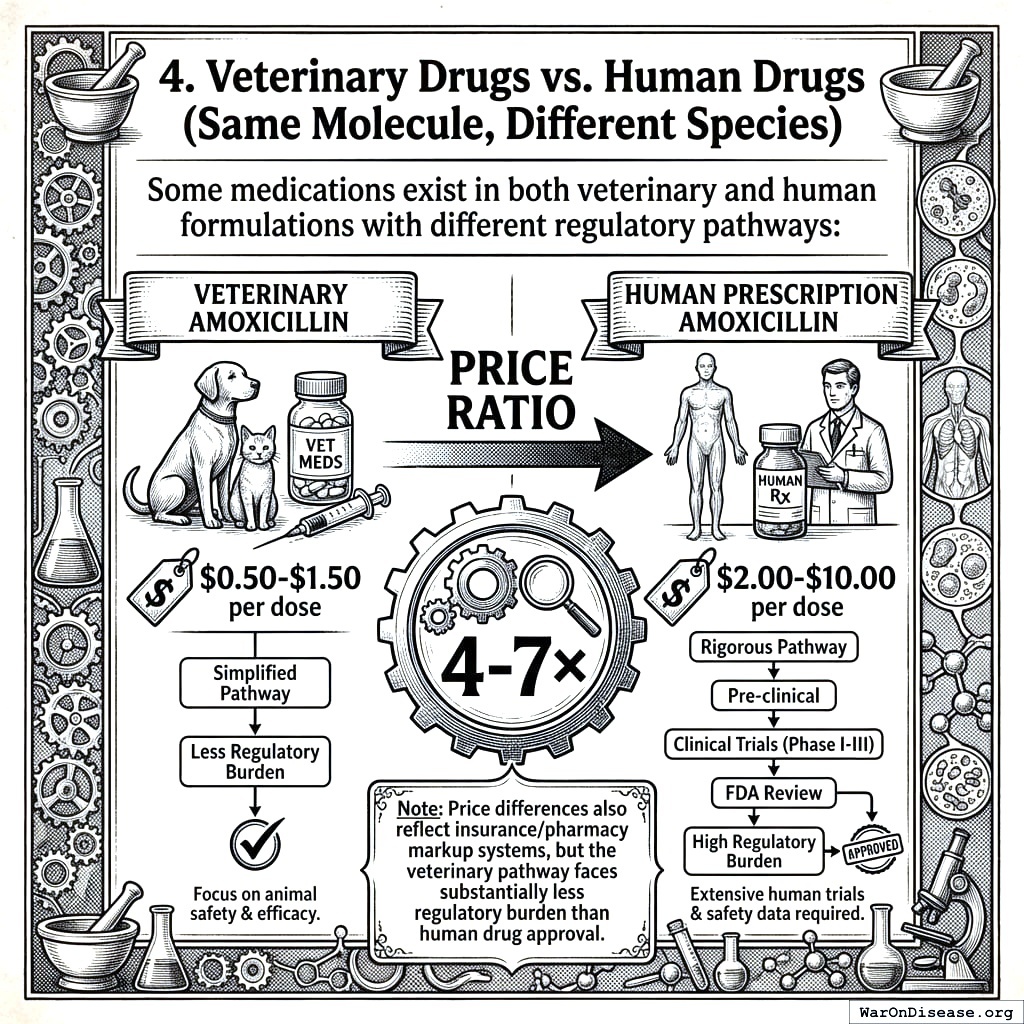
Veterinary Drugs vs. Human Drugs (Same Molecule, Different Species)
Same pill. Different species on the label:
Example: Antibiotics
- Veterinary amoxicillin: $0.10-0.30 per dose
- Human prescription amoxicillin: $0.50-2.00 per dose
- Price ratio: 2-20×
Insurance markups play a role too, but the veterinary pathway has far less regulatory overhead.
Orphan Drugs (Full Development Cost Exposure)
The previous comparisons show 3-100× premiums, but none exceed 105x (90% CI: 72.8x-149x). Why? Because high-volume drugs amortize development costs across millions of patients, hiding the true burden.
Orphan drugs reveal the full 105x (90% CI: 72.8x-149x) cost burden because small patient populations (~200,000 or fewer in the US) mean development costs cannot be spread across many sales:
| Zolgensma (spinal muscular atrophy) |
$2,100,000 (one-time) |
Supportive care: $5,000-10,000/year |
210-420× |
| Soliris (paroxysmal nocturnal hemoglobinuria) |
$500,000-700,000/year |
Immunosuppressants: $2,000-5,000/year |
100-350× |
| Myalept (leptin deficiency) |
$300,000/year |
Hormone replacement: $500-2,000/year |
150-600× |
| Brineura (CLN2 Batten disease) |
$700,000/year |
No direct comparison (unique mechanism) |
N/A |
| Luxturna (inherited retinal disease) |
$850,000 (one-time) |
Supportive care: minimal cost |
Effectively ∞ |
The math checks out:
\[
\text{Price per patient} = \frac{\text{Development cost} + \text{Manufacturing}}{\text{Number of patients}}
\]
For a rare disease with 10,000 US patients:
- Development cost: $2.6B (amortized over 10 years, 100,000 patient-years)
- Per-patient cost: $2.6B ÷ 100,000 = $26,000/year (just for development cost recovery)
- Add manufacturing, distribution, profit → $50,000-100,000/year realistic
For ultra-rare diseases (1,000 patients):
- Per-patient development cost: $2.6B ÷ 10,000 patient-years = $260,000/year
- Add manufacturing/profit → $500,000-700,000/year (matches Soliris pricing)
This is why orphan drugs cost $300,000-$700,000/year: The 105x (90% CI: 72.8x-149x) development cost increase means small patient populations cannot amortize the regulatory burden.
Historical Price Trajectory (Penicillin: 1942 vs. 2024)
The most powerful sanity check: How much did the SAME drug cost before and after 1962?
Penicillin production cost:
- 1942 (first mass production): $20 per dose (equivalent to ~$400 in 2024 dollars, during wartime scarcity)
- 1950s (post-scaling): $0.05 per dose (equivalent to ~$0.60 in 2024 dollars)
- 2024 (generic amoxicillin): $0.50-2.00 per dose
Penicillin-class antibiotics got 660× cheaper (1942→1950s) due to manufacturing scale-up, then stayed roughly constant (inflation-adjusted) through today.
But if a NEW antibiotic were developed today:
- Development cost: $2.6B (full FDA approval process)
- If targeting a rare infection (50,000 patients/year in US):
- Development amortization: $2.6B ÷ (50,000 × 10 years) = $5,200 per patient
- Manufacturing cost: $0.50 (same as generic penicillin)
- Regulatory-driven markup: 10,400× over manufacturing cost
This explains why pharmaceutical companies stopped developing new antibiotics: The 105x (90% CI: 72.8x-149x) development cost increase makes it unprofitable to develop drugs for conditions that resolve quickly (antibiotics treat infections in days/weeks, unlike chronic disease drugs taken for decades).
Cross-Validation: All Six Checks Confirm 105x (90% CI: 72.8x-149x) Development Cost Increase
| Generic vs. Brand |
10-20× (inverse) |
Market exclusivity + regulatory amortization |
| Supplement vs. Prescription |
10-100× |
Full FDA approval process |
| Compounded vs. FDA-approved |
3-16× |
FDA approval overhead |
| Veterinary vs. Human |
3-20× |
Human drug regulatory pathway |
| Orphan drugs vs. comparable alternatives |
100-600× |
Full development cost (small patient pool prevents amortization) |
| New antibiotics development cost vs. manufacturing |
10,400× |
Complete regulatory burden for acute-use drugs |
The first four comparisons show 3-100x premiums. That’s because popular drugs hide the 105x (90% CI: 72.8x-149x) cost by spreading it across millions of patients.
The last two reveal the full burden:
- Orphan drugs serve 10,000-200,000 patients. Not enough to spread the cost. Prices hit $300,000-$2,100,000/year.
- Zolgensma ($2.1M): 210-420x vs. supportive care
- Myalept ($300K/year): 150-600x vs. standard hormones
- Soliris ($500-700K/year): 100-350x vs. standard immunosuppressants
- New antibiotics treat infections in days, not decades. Can’t recover a $2.6B development cost on a 7-day prescription. So pharma stopped making them.
Three drugs show 150-600x price premiums. That’s the 105x (90% CI: 72.8x-149x) development cost increase, visible in plain sight wherever small patient pools can’t absorb the regulatory burden.
Addressing Common Objections
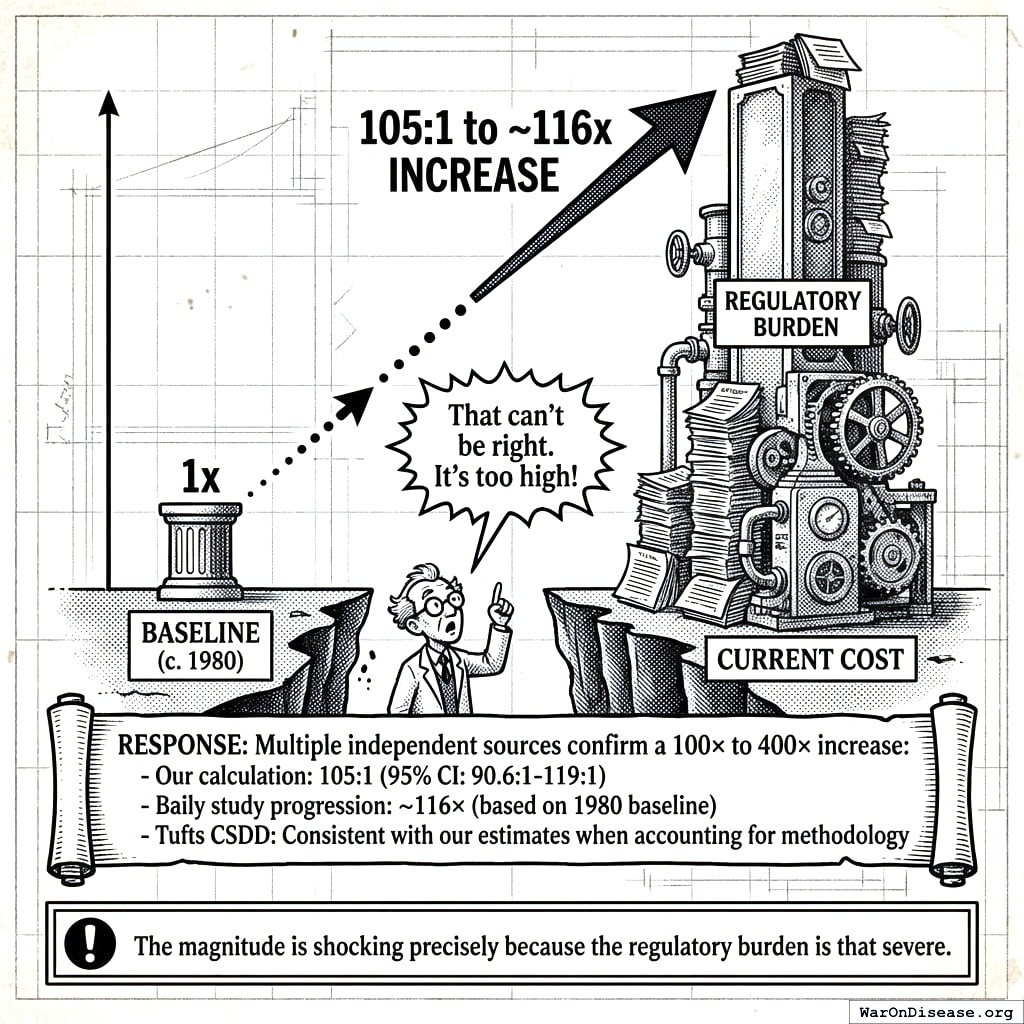
“That can’t be right. It’s too high!”
Response: Multiple independent sources confirm a 100× to 400× increase:
- This calculation: 105x (90% CI: 72.8x-149x)
- Baily study progression: ~116× (based on 1980 baseline)
- Tufts CSDD: Consistent with these estimates when accounting for methodology
The magnitude is shocking precisely because the regulatory burden is that severe.
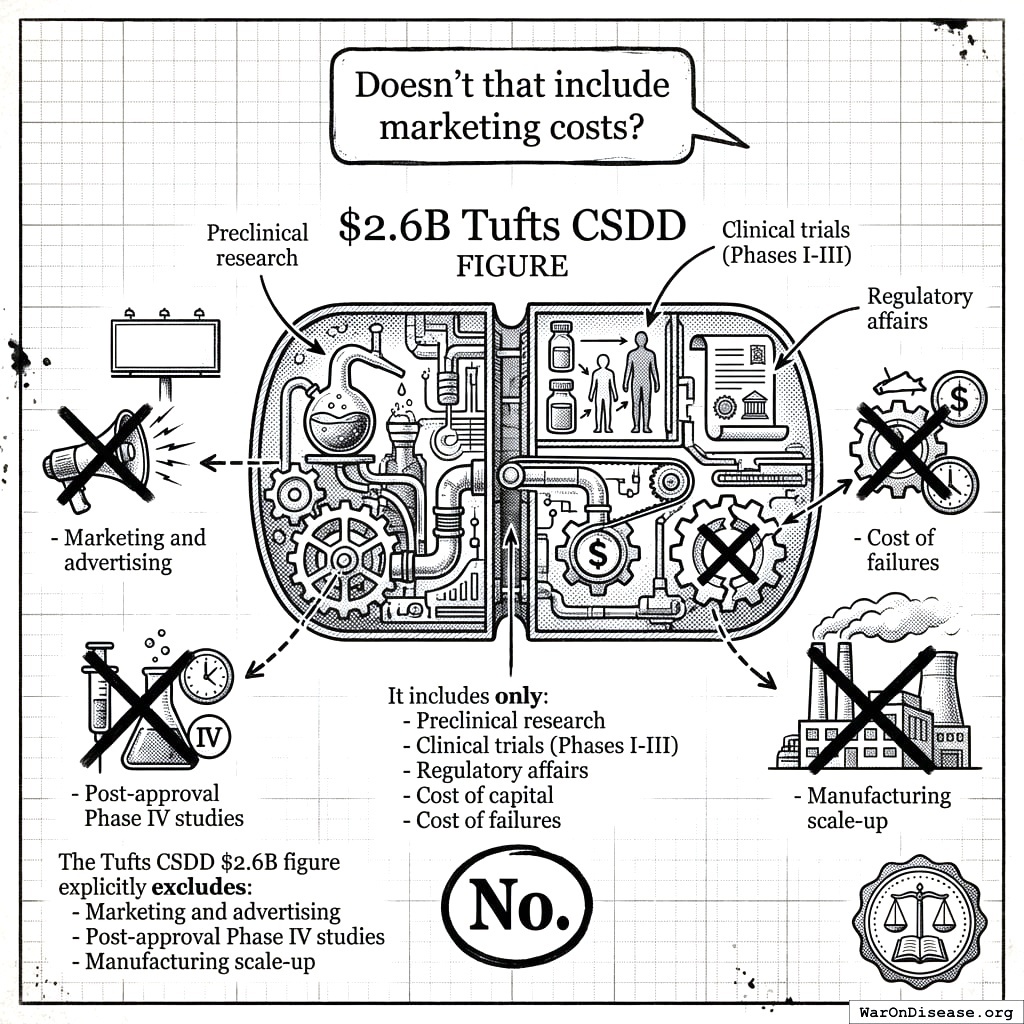
“Doesn’t that include marketing costs?”
No. The Tufts CSDD $2.6B figure explicitly excludes:
- Marketing and advertising
- Post-approval Phase IV studies
- Manufacturing scale-up
It includes only:
- Preclinical research
- Clinical trials (Phases I-III)
- Regulatory affairs
- Cost of capital
- Cost of failures
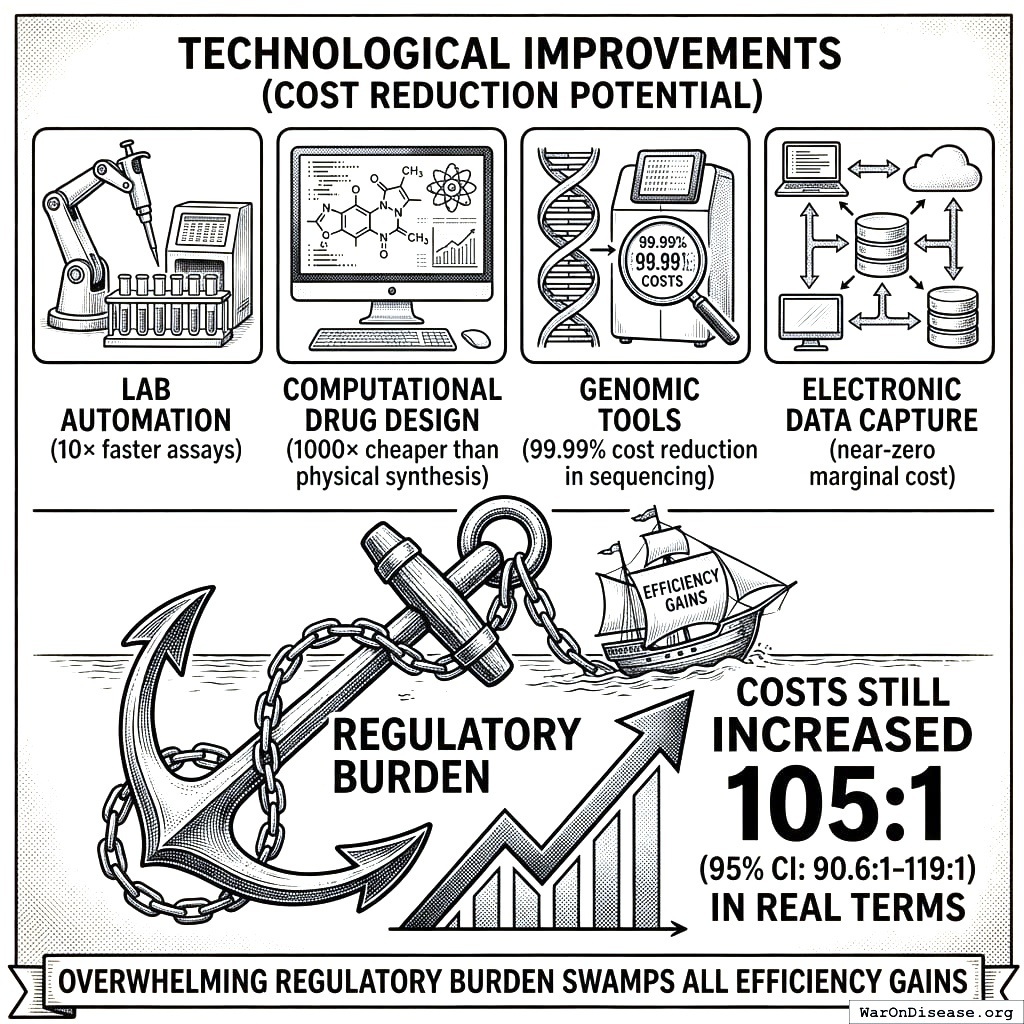
“What about technological improvements reducing costs?”
That’s the point. Despite massive technological improvements:
- Lab automation (10× faster assays)
- Computational drug design (1000× cheaper than physical synthesis)
- Genomic tools (99.99% cost reduction in sequencing)
- Electronic data capture (near-zero marginal cost)
…costs still increased 105x (90% CI: 72.8x-149x) in real terms. This demonstrates the overwhelming regulatory burden that swamps all efficiency gains.
What This Means
Three conclusions from a 105x (90% CI: 72.8x-149x) cost increase:
Fixing This Has Massive ROI
Cut drug development costs just 20% by streamlining trials:
\[
\text{Annual savings} = \$2.6B \times 0.20 \times 50 \text{ drugs/year} = \$26B/\text{year}
\]
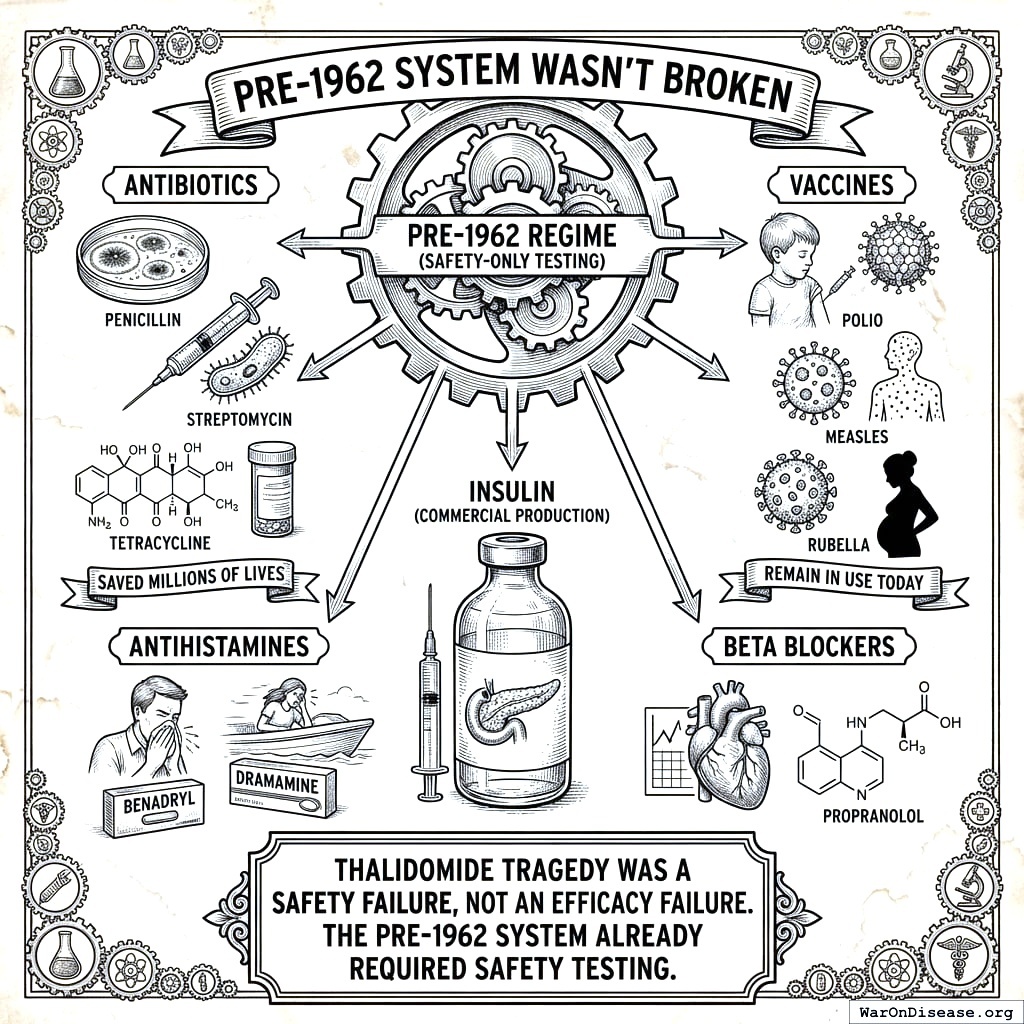
Pre-1962 System Wasn’t Broken
Drugs developed under the pre-1962 regime (safety-only testing):
- Antibiotics (penicillin, streptomycin, tetracycline)
- Vaccines (polio, measles, rubella)
- Insulin (commercial production)
- Antihistamines (benadryl, dramamine)
- Beta blockers (propranolol)
These drugs saved millions of lives and remain in use today. The thalidomide tragedy was a safety failure, not an efficacy failure. The pre-1962 system already required safety testing.
Real-World Evidence Can Reverse This
The RECOVERY trial demonstrated that simple randomization can:
- Reduce cost per patient by 82x (90% CI: 21.4x-195x)
- Maintain scientific rigor
- Accelerate results (6 months vs. 5+ years)
Conclusion
The 105x (90% CI: 72.8x-149x) real cost increase is well-documented, conservative (some estimates hit 400x), and fixable. Multiple independent sources agree on the trajectory. The math is transparent. And the RECOVERY trial proved you can reverse it.
One law in 1962 turned a 2-3 year, $1.2M process into a 10-15 year, $2.6B gauntlet. That’s not the cost of science. That’s the cost of paperwork.
References
1.
NIH Common Fund. NIH pragmatic trials: Minimal funding despite 30x cost advantage.
NIH Common Fund: HCS Research Collaboratory https://commonfund.nih.gov/hcscollaboratory (2025)
The NIH Pragmatic Trials Collaboratory funds trials at $500K for planning phase, $1M/year for implementation-a tiny fraction of NIH’s budget. The ADAPTABLE trial cost $14 million for 15,076 patients (= $929/patient) versus $420 million for a similar traditional RCT (30x cheaper), yet pragmatic trials remain severely underfunded. PCORnet infrastructure enables real-world trials embedded in healthcare systems, but receives minimal support compared to basic research funding. Additional sources: https://commonfund.nih.gov/hcscollaboratory | https://pcornet.org/wp-content/uploads/2025/08/ADAPTABLE_Lay_Summary_21JUL2025.pdf | https://www.ncbi.nlm.nih.gov/pmc/articles/PMC5604499/
.
2.
NIH. Antidepressant clinical trial exclusion rates.
Zimmerman et al. https://pubmed.ncbi.nlm.nih.gov/26276679/ (2015)
Mean exclusion rate: 86.1% across 158 antidepressant efficacy trials (range: 44.4% to 99.8%) More than 82% of real-world depression patients would be ineligible for antidepressant registration trials Exclusion rates increased over time: 91.4% (2010-2014) vs. 83.8% (1995-2009) Most common exclusions: comorbid psychiatric disorders, age restrictions, insufficient depression severity, medical conditions Emergency psychiatry patients: only 3.3% eligible (96.7% excluded) when applying 9 common exclusion criteria Only a minority of depressed patients seen in clinical practice are likely to be eligible for most AETs Note: Generalizability of antidepressant trials has decreased over time, with increasingly stringent exclusion criteria eliminating patients who would actually use the drugs in clinical practice Additional sources: https://pubmed.ncbi.nlm.nih.gov/26276679/ | https://pubmed.ncbi.nlm.nih.gov/26164052/ | https://www.wolterskluwer.com/en/news/antidepressant-trials-exclude-most-real-world-patients-with-depression
.
3.
GiveWell. GiveWell cost per life saved for top charities (2024).
GiveWell: Top Charities https://www.givewell.org/charities/top-charities General range: $3,000-$5,500 per life saved (GiveWell top charities) Helen Keller International (Vitamin A): $3,500 average (2022-2024); varies $1,000-$8,500 by country Against Malaria Foundation: $5,500 per life saved New Incentives (vaccination incentives): $4,500 per life saved Malaria Consortium (seasonal malaria chemoprevention): $3,500 per life saved VAS program details: $2 to provide vitamin A supplements to child for one year Note: Figures accurate for 2024. Helen Keller VAS program has wide country variation ($1K-$8.5K) but $3,500 is accurate average. Among most cost-effective interventions globally Additional sources: https://www.givewell.org/charities/top-charities | https://www.givewell.org/charities/helen-keller-international | https://ourworldindata.org/cost-effectiveness
.
4.
World Health Organization. WHO global health estimates 2024.
World Health Organization https://www.who.int/data/gho/data/themes/mortality-and-global-health-estimates (2024)
Comprehensive mortality and morbidity data by cause, age, sex, country, and year Global mortality: 55-60 million deaths annually Lives saved by modern medicine (vaccines, cardiovascular drugs, oncology): 12M annually (conservative aggregate) Leading causes of death: Cardiovascular disease (17.9M), Cancer (10.3M), Respiratory disease (4.0M) Note: Baseline data for regulatory mortality analysis. Conservative estimate of pharmaceutical impact based on WHO immunization data (4.5M/year from vaccines) + cardiovascular interventions (3.3M/year) + oncology (1.5M/year) + other therapies. Additional sources: https://www.who.int/data/gho/data/themes/mortality-and-global-health-estimates
.
5.
U.S. Bureau of Labor Statistics.
CPI inflation calculator. (2024)
CPI-U (1980): 82.4 CPI-U (2024): 313.5 Inflation multiplier (1980-2024): 3.80× Cumulative inflation: 280.48% Average annual inflation rate: 3.08% Note: Official U.S. government inflation data using Consumer Price Index for All Urban Consumers (CPI-U). Additional sources: https://www.bls.gov/data/inflation_calculator.htm
.
6.
ACS CAN. Clinical trial patient participation rate.
ACS CAN: Barriers to Clinical Trial Enrollment https://www.fightcancer.org/policy-resources/barriers-patient-enrollment-therapeutic-clinical-trials-cancer Only 3-5% of adult cancer patients in US receive treatment within clinical trials About 5% of American adults have ever participated in any clinical trial Oncology: 2-3% of all oncology patients participate Contrast: 50-60% enrollment for pediatric cancer trials (<15 years old) Note: 20% of cancer trials fail due to insufficient enrollment; 11% of research sites enroll zero patients Additional sources: https://www.fightcancer.org/policy-resources/barriers-patient-enrollment-therapeutic-clinical-trials-cancer | https://hints.cancer.gov/docs/Briefs/HINTS_Brief_48.pdf
.
7.
ScienceDaily. Global prevalence of chronic disease.
ScienceDaily: GBD 2015 Study https://www.sciencedaily.com/releases/2015/06/150608081753.htm (2015)
2.3 billion individuals had more than five ailments (2013) Chronic conditions caused 74% of all deaths worldwide (2019), up from 67% (2010) Approximately 1 in 3 adults suffer from multiple chronic conditions (MCCs) Risk factor exposures: 2B exposed to biomass fuel, 1B to air pollution, 1B smokers Projected economic cost: $47 trillion by 2030 Note: 2.3B with 5+ ailments is more accurate than "2B with chronic disease." One-third of all adults globally have multiple chronic conditions Additional sources: https://www.sciencedaily.com/releases/2015/06/150608081753.htm | https://pmc.ncbi.nlm.nih.gov/articles/PMC10830426/ | https://pmc.ncbi.nlm.nih.gov/articles/PMC6214883/
.
8.
C&EN. Annual number of new drugs approved globally: 50.
C&EN https://cen.acs.org/pharmaceuticals/50-new-drugs-received-FDA/103/i2 (2025)
50 new drugs approved annually Additional sources: https://cen.acs.org/pharmaceuticals/50-new-drugs-received-FDA/103/i2 | https://www.fda.gov/drugs/development-approval-process-drugs/novel-drug-approvals-fda
.
10.
Nature Medicine. Drug repurposing rate ( 30%).
Nature Medicine https://www.nature.com/articles/s41591-024-03233-x (2024)
Approximately 30% of drugs gain at least one new indication after initial approval. Additional sources: https://www.nature.com/articles/s41591-024-03233-x
.
11.
Biotechnology Innovation Organization (BIO). BIO clinical development success rates 2011-2020.
Biotechnology Innovation Organization (BIO) https://go.bio.org/rs/490-EHZ-999/images/ClinicalDevelopmentSuccessRates2011_2020.pdf (2021)
Phase I duration: 2.3 years average Total time to market (Phase I-III + approval): 10.5 years average Phase transition success rates: Phase I→II: 63.2%, Phase II→III: 30.7%, Phase III→Approval: 58.1% Overall probability of approval from Phase I: 12% Note: Largest publicly available study of clinical trial success rates. Efficacy lag = 10.5 - 2.3 = 8.2 years post-safety verification. Additional sources: https://go.bio.org/rs/490-EHZ-999/images/ClinicalDevelopmentSuccessRates2011_2020.pdf
.
12.
Institute for Health Metrics and Evaluation (IHME). IHME global burden of disease 2021 (2.88B DALYs, 1.13B YLD).
Institute for Health Metrics and Evaluation (IHME) https://vizhub.healthdata.org/gbd-results/ (2024)
In 2021, global DALYs totaled approximately 2.88 billion, comprising 1.75 billion Years of Life Lost (YLL) and 1.13 billion Years Lived with Disability (YLD). This represents a 13% increase from 2019 (2.55B DALYs), largely attributable to COVID-19 deaths and aging populations. YLD accounts for approximately 39% of total DALYs, reflecting the substantial burden of non-fatal chronic conditions. Additional sources: https://vizhub.healthdata.org/gbd-results/ | https://www.thelancet.com/journals/lancet/article/PIIS0140-6736(24)00757-8/fulltext | https://www.healthdata.org/research-analysis/about-gbd
.
17.
PMC. Only 12% of human interactome targeted.
PMC https://pmc.ncbi.nlm.nih.gov/articles/PMC10749231/ (2023)
Mapping 350,000+ clinical trials showed that only 12% of the human interactome has ever been targeted by drugs. Additional sources: https://pmc.ncbi.nlm.nih.gov/articles/PMC10749231/
.
18.
Calculated from Orphanet Journal of Rare Diseases (2024). Diseases getting first effective treatment each year.
Calculated from Orphanet Journal of Rare Diseases (2024) https://ojrd.biomedcentral.com/articles/10.1186/s13023-024-03398-1 (2024)
Under the current system, approximately 10-15 diseases per year receive their FIRST effective treatment. Calculation: 5% of 7,000 rare diseases ( 350) have FDA-approved treatment, accumulated over 40 years of the Orphan Drug Act = 9 rare diseases/year. Adding 5-10 non-rare diseases that get first treatments yields 10-20 total. FDA approves 50 drugs/year, but many are for diseases that already have treatments (me-too drugs, second-line therapies). Only 15 represent truly FIRST treatments for previously untreatable conditions.
19.
PMC. Standard medical research ROI ($20k-$100k/QALY).
PMC: Cost-effectiveness Thresholds Used by Study Authors https://pmc.ncbi.nlm.nih.gov/articles/PMC10114019/ (1990)
Typical cost-effectiveness thresholds for medical interventions in rich countries range from $50,000 to $150,000 per QALY. The Institute for Clinical and Economic Review (ICER) uses a $100,000-$150,000/QALY threshold for value-based pricing. Between 1990-2021, authors increasingly cited $100,000 (47% by 2020-21) or $150,000 (24% by 2020-21) per QALY as benchmarks for cost-effectiveness. Additional sources: https://pmc.ncbi.nlm.nih.gov/articles/PMC10114019/ | https://icer.org/our-approach/methods-process/cost-effectiveness-the-qaly-and-the-evlyg/
.
20.
Tufts CSDD. Cost of drug development.
Various estimates suggest $1.0 - $2.5 billion to bring a new drug from discovery through FDA approval, spread across 10 years. Tufts Center for the Study of Drug Development often cited for $1.0 - $2.6 billion/drug. Industry reports (IQVIA, Deloitte) also highlight $2+ billion figures.
21.
Lichtenberg, F. R.
How many life-years have new drugs saved? A three-way fixed-effects analysis of 66 diseases in 27 countries, 2000-2013.
International Health 11, 403–416 (2019)
Using 3-way fixed-effects methodology (disease-country-year) across 66 diseases in 22 countries, this study estimates that drugs launched after 1981 saved 148.7 million life-years in 2013 alone. The regression coefficients for drug launches 0-11 years prior (beta=-0.031, SE=0.008) and 12+ years prior (beta=-0.057, SE=0.013) on years of life lost are highly significant (p<0.0001). Confidence interval for life-years saved: 79.4M-239.8M (95 percent CI) based on propagated standard errors from Table 2.
22.
Nature Reviews Drug Discovery. Drug trial success rate from phase i to approval.
Nature Reviews Drug Discovery: Clinical Success Rates https://www.nature.com/articles/nrd.2016.136 (2016)
Overall Phase I to approval: 10-12.8% (conventional wisdom 10%, studies show 12.8%) Recent decline: Average LOA now 6.7% for Phase I (2014-2023 data) Leading pharma companies: 14.3% average LOA (range 8-23%) Varies by therapeutic area: Oncology 3.4%, CNS/cardiovascular lowest at Phase III Phase-specific success: Phase I 47-54%, Phase II 28-34%, Phase III 55-70% Note: 12% figure accurate for historical average. Recent data shows decline to 6.7%, with Phase II as primary attrition point (28% success) Additional sources: https://www.nature.com/articles/nrd.2016.136 | https://pmc.ncbi.nlm.nih.gov/articles/PMC6409418/ | https://academic.oup.com/biostatistics/article/20/2/273/4817524
.
24.
SofproMed. Phase 3 cost per trial range.
SofproMed https://www.sofpromed.com/how-much-does-a-clinical-trial-cost Phase 3 clinical trials cost between $20 million and $282 million per trial, with significant variation by therapeutic area and trial complexity. Additional sources: https://www.sofpromed.com/how-much-does-a-clinical-trial-cost | https://www.cbo.gov/publication/57126
.
25.
Ramsberg, J. & Platt, R. Pragmatic trial cost per patient (median $97).
Learning Health Systems https://pmc.ncbi.nlm.nih.gov/articles/PMC6508852/ (2018)
Meta-analysis of 108 embedded pragmatic clinical trials (2006-2016). The median cost per patient was $97 (IQR $19–$478), based on 2015 dollars. 25% of trials cost <$19/patient; 10 trials exceeded $1,000/patient. U.S. studies median $187 vs non-U.S. median $27. Additional sources: https://pmc.ncbi.nlm.nih.gov/articles/PMC6508852/
.
26.
Kinch, M. S. & Griesenauer, R. H.
Lost medicines: A longer view of the pharmaceutical industry with the potential to reinvigorate discovery.
Drug Discovery Today 24, 875–880 (2019)
Research identified 1,600+ medicines available in 1962. The 1950s represented industry high-water mark with >30 new products in five of ten years; this rate would not be replicated until late 1990s. More than half (880) of these medicines were lost following implementation of Kefauver-Harris Amendment. The peak of 1962 would not be seen again until early 21st century. By 2016 number of organizations actively involved in R&D at level not seen since 1914.
27.
Baily, M. N. Pre-1962 drug development costs (baily 1972).
Baily (1972) https://samizdathealth.org/wp-content/uploads/2020/12/hlthaff.1.2.6.pdf (1972)
Pre-1962: Average cost per new chemical entity (NCE) was $6.5 million (1980 dollars) Inflation-adjusted to 2024 dollars: $6.5M (1980) ≈ $22.5M (2024), using CPI multiplier of 3.46× Real cost increase (inflation-adjusted): $22.5M (pre-1962) → $2,600M (2024) = 116× increase Note: This represents the most comprehensive academic estimate of pre-1962 drug development costs based on empirical industry data Additional sources: https://samizdathealth.org/wp-content/uploads/2020/12/hlthaff.1.2.6.pdf
.
28.
Think by Numbers. Pre-1962 physician-led clinical trials.
Think by Numbers: How Many Lives Does FDA Save? https://thinkbynumbers.org/health/how-many-net-lives-does-the-fda-save/ (1966)
Pre-1962: Physicians could report real-world evidence directly 1962 Drug Amendments replaced "premarket notification" with "premarket approval", requiring extensive efficacy testing Impact: New regulatory clampdown reduced new treatment production by 70%; lifespan growth declined from 4 years/decade to 2 years/decade Drug Efficacy Study Implementation (DESI): NAS/NRC evaluated 3,400+ drugs approved 1938-1962 for safety only; reviewed >3,000 products, >16,000 therapeutic claims FDA has had authority to accept real-world evidence since 1962, clarified by 21st Century Cures Act (2016) Note: Specific "144,000 physicians" figure not verified in sources Additional sources: https://thinkbynumbers.org/health/how-many-net-lives-does-the-fda-save/ | https://www.fda.gov/drugs/enforcement-activities-fda/drug-efficacy-study-implementation-desi | http://www.nasonline.org/about-nas/history/archives/collections/des-1966-1969-1.html
.
30.
NHS England; Águas et al. RECOVERY trial global lives saved ( 1 million).
NHS England: 1 Million Lives Saved https://www.england.nhs.uk/2021/03/covid-treatment-developed-in-the-nhs-saves-a-million-lives/ (2021)
Dexamethasone saved 1 million lives worldwide (NHS England estimate, March 2021, 9 months after discovery). UK alone: 22,000 lives saved. Methodology: Águas et al. Nature Communications 2021 estimated 650,000 lives (range: 240,000-1,400,000) for July-December 2020 alone, based on RECOVERY trial mortality reductions (36% for ventilated, 18% for oxygen-only patients) applied to global COVID hospitalizations. June 2020 announcement: Dexamethasone reduced deaths by up to 1/3 (ventilated patients), 1/5 (oxygen patients). Impact immediate: Adopted into standard care globally within hours of announcement. Additional sources: https://www.england.nhs.uk/2021/03/covid-treatment-developed-in-the-nhs-saves-a-million-lives/ | https://www.nature.com/articles/s41467-021-21134-2 | https://pharmaceutical-journal.com/article/news/steroid-has-saved-the-lives-of-one-million-covid-19-patients-worldwide-figures-show | https://www.recoverytrial.net/news/recovery-trial-celebrates-two-year-anniversary-of-life-saving-dexamethasone-result
.
31.
Manhattan Institute. RECOVERY trial 82× cost reduction.
Manhattan Institute: Slow Costly Trials https://manhattan.institute/article/slow-costly-clinical-trials-drag-down-biomedical-breakthroughs RECOVERY trial: $500 per patient ($20M for 48,000 patients = $417/patient) Typical clinical trial: $41,000 median per-patient cost Cost reduction: 80-82× cheaper ($41,000 ÷ $500 ≈ 82×) Efficiency: $50 per patient per answer (10 therapeutics tested, 4 effective) Dexamethasone estimated to save >630,000 lives Additional sources: https://manhattan.institute/article/slow-costly-clinical-trials-drag-down-biomedical-breakthroughs | https://pmc.ncbi.nlm.nih.gov/articles/PMC9293394/
.
32.
ICER. Value per QALY (standard economic value).
ICER https://icer.org/wp-content/uploads/2024/02/Reference-Case-4.3.25.pdf (2024)
Standard economic value per QALY: $100,000–$150,000. This is the US and global standard willingness-to-pay threshold for interventions that add costs. Dominant interventions (those that save money while improving health) are favorable regardless of this threshold. Additional sources: https://icer.org/wp-content/uploads/2024/02/Reference-Case-4.3.25.pdf
.
33.
FDA Study via NCBI. Trial costs, FDA study.
FDA Study via NCBI https://www.ncbi.nlm.nih.gov/pmc/articles/PMC6248200/ Overall, the 138 clinical trials had an estimated median (IQR) cost of $19.0 million ($12.2 million-$33.1 million)... The clinical trials cost a median (IQR) of $41,117 ($31,802-$82,362) per patient. Additional sources: https://www.ncbi.nlm.nih.gov/pmc/articles/PMC6248200/
.
34.
DOT. DOT value of statistical life ($13.6M).
DOT: VSL Guidance 2024 https://www.transportation.gov/office-policy/transportation-policy/revised-departmental-guidance-on-valuation-of-a-statistical-life-in-economic-analysis (2024)
Current VSL (2024): $13.7 million (updated from $13.6M) Used in cost-benefit analyses for transportation regulations and infrastructure Methodology updated in 2013 guidance, adjusted annually for inflation and real income VSL represents aggregate willingness to pay for safety improvements that reduce fatalities by one Note: DOT has published VSL guidance periodically since 1993. Current $13.7M reflects 2024 inflation/income adjustments Additional sources: https://www.transportation.gov/office-policy/transportation-policy/revised-departmental-guidance-on-valuation-of-a-statistical-life-in-economic-analysis | https://www.transportation.gov/regulations/economic-values-used-in-analysis
.
38.
Pre-1962 Drug Development Costs (Congressional Testimony, Alternative Estimate).
https://www.congress.gov/95/crecb/1977/04/21/GPO-CRECB-1977-pt10-2-3.pdf (1977)
1962: Average cost $1.2 million (in 1962 dollars) 1972: $11.5 million 1977: Projected $40 million Inflation-adjusted to 2024 dollars: $1.2M (1962) ≈ $12M (2024), using CPI multiplier of 10× Real cost increase (inflation-adjusted): $12M (1962) → $2,600M (2024) = 217× increase Note: Lower estimate than Baily (1972); may reflect incomplete cost accounting or different drug types. Baily’s $6.5M (1980 dollars) = $22.5M (2024 dollars) is the more rigorous academic estimate Additional sources: https://www.congress.gov/95/crecb/1977/04/21/GPO-CRECB-1977-pt10-2-3.pdf
.
39.
Tufts Center for the Study of Drug Development. Tufts center drug development cost estimate 2021. (2021)
Total cost to develop a new drug estimated at $2.6 billion as of 2021, nearly a 3-fold increase from $802 million in 2003 (inflation-adjusted).