
The Invisible Graveyard: Quantifying the Mortality Cost of FDA Efficacy Lag
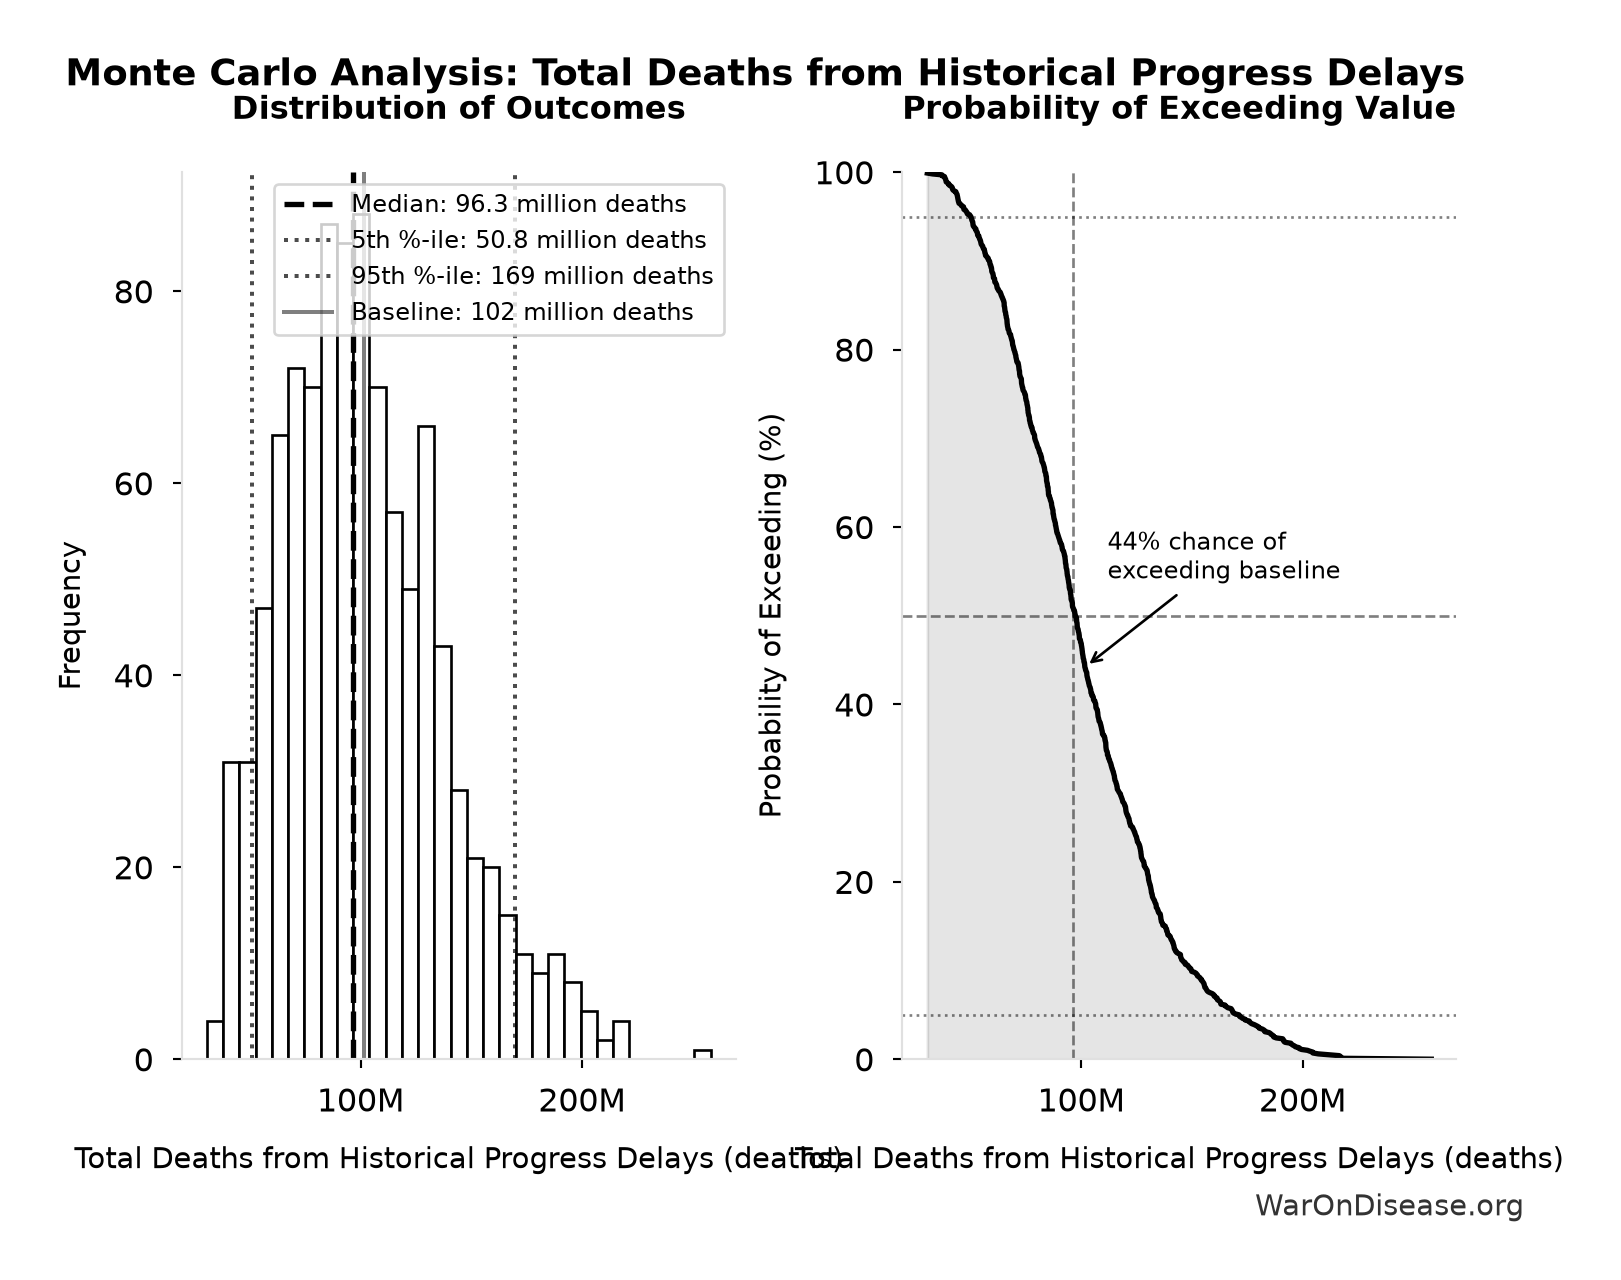
After proving a drug is safe, the FDA requires 8.2 years (90% CI: 4.84 years-11.5 years) to prove it works before patients can access it. We estimate this delay cost 102 million deaths (90% CI: 50.8 million deaths-169 million deaths) among people waiting for approved drugs (1962-2024). The human cost in death and disability of blocking good drugs is 3,389 (90% CI: 1,811-5,734) higher than the cost of approving bad ones.
Abstract
This study quantifies the cumulative mortality and morbidity costs associated with the Unitary Pre-Market Approval (UPMA) model mandated by the 1962 Kefauver-Harris Amendments. By enforcing efficacy testing prior to market entry, the current regulatory framework imposes an average “Efficacy Lag” of 8.2 years (90% CI: 4.84 years-11.5 years) post-safety verification. Using data from the Tufts Center for the Study of Drug Development (CSDD) and the WHO Global Burden of Disease (GBD) database, we estimate two distinct mortality costs: (1) Historical mortality (1962-2024): approximately 102 million people died waiting for approved drugs during their approval delays, representing a lower bound excluding drugs never developed due to cost barriers; (2) Future timeline shift: an additional 416 million will eventually die because the disease eradication timeline has been pushed back by 8.2 years (90% CI: 4.84 years-11.5 years). Combined, these represent 8.77 billion Disability-Adjusted Life Years when adjusted for morbidity, with a cumulative economic deadweight loss of approximately $1.32 quadrillion (90% CI: $676 trillion-$2.14 quadrillion) (2024 USD), reflecting 8.77 billion DALYs valued at the standard WHO cost-effectiveness threshold of $150,000 (90% CI: $100,384-$198,679)/DALY. The societal cost of Type II Regulatory Errors (delayed access to effective therapies) exceeds the averted cost of Type I Regulatory Errors (market access for ineffective therapies) by a factor of 3,389 (90% CI: 1,811-5,734).
Keywords
fda-regulation, drug-lag, kefauver-harris-amendments, regulatory-delay, type-ii-errors, mortality-analysis, cost-benefit-analysis, pharmaceutical-regulation, dalys, efficacy-requirements, peltzman, regulatory-economics
1 The Short Version
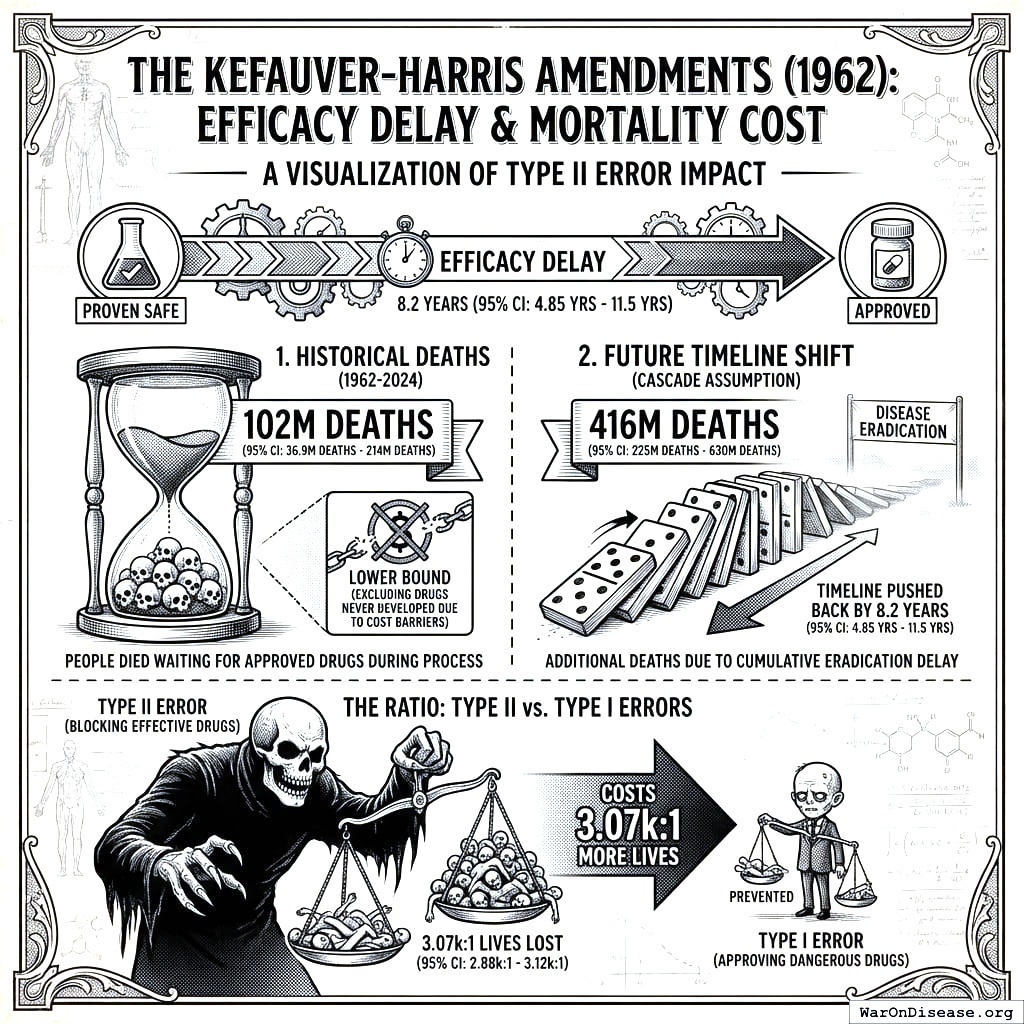
A drug is proven safe. It might cure your disease. The FDA says you cannot have it yet because they need 8.2 years (90% CI: 4.84 years-11.5 years) to confirm it works (the 1962 Kefauver-Harris Amendments). You die during those 8.2 years (90% CI: 4.84 years-11.5 years). The drug is then approved and given to people who are not you, because you are dead. This has happened 102 million times since 1962. It is called “consumer protection.” Two distinct mortality costs:
- Historical deaths (1962-2024): 102 million people died waiting for approved drugs during their approval process - a lower bound excluding drugs never developed due to cost barriers
- Future timeline shift (under cascade assumption): 416 million additional deaths will occur because the entire disease eradication timeline is pushed back by 8.2 years (90% CI: 4.84 years-11.5 years)
The ratio: Type II errors (blocking effective drugs) cost 3,389 (90% CI: 1,811-5,734) more lives than Type I errors (approving dangerous drugs) prevent.
2 Abstract
This study quantifies the cumulative mortality and morbidity costs associated with the Unitary Pre-Market Approval (UPMA) model mandated by the 1962 Kefauver-Harris Amendments. By enforcing efficacy testing prior to market entry, the current regulatory framework imposes an average “Efficacy Lag” of 8.2 years (90% CI: 4.84 years-11.5 years) post-safety verification.
Using data from the Tufts Center for the Study of Drug Development (CSDD) and the WHO Global Burden of Disease (GBD) database, we estimate two distinct mortality costs:
Historical mortality (1962-2024): Approximately 102 million people died waiting for approved drugs during their 8.2 years (90% CI: 4.84 years-11.5 years) approval delays. This is a lower bound - it excludes drugs never developed due to cost barriers.
Future timeline shift (under cascade assumption): An additional 416 million will eventually die because the entire disease eradication timeline has been pushed back by 8.2 years (90% CI: 4.84 years-11.5 years). When cures finally arrive, they arrive 8.2 years (90% CI: 4.84 years-11.5 years) later than they would have without efficacy requirements. During that delay, people die.
Historical Deaths Calculation:
\[
\begin{gathered}
Deaths_{lag,total} \\
= Lives_{saved,annual} \times T_{lag} \\
= 12.4M \times 8.2 \\
= 102M
\end{gathered}
\]
where:
\[
\begin{gathered}
Lives_{saved,annual} \\
= \frac{LY_{saved,annual}}{T_{ext}} \\
= \frac{149M}{12} \\
= 12.4M
\end{gathered}
\]
Simulation Results Summary: Total Deaths from Historical Progress Delays
| Statistic | Value |
|---|---|
| Baseline (deterministic) | 102 million |
| Mean (expected value) | 101 million |
| Median (50th percentile) | 96.3 million |
| Standard Deviation | 36.3 million |
| 90% Range (5th-95th percentile) | [50.8 million, 169 million] |
The histogram shows 1,000 of the 10,000 Monte Carlo draws for Total Deaths from Historical Progress Delays; the summary statistics use all 10,000. The exceedance curve (right) shows the probability of the outcome exceeding any given value.
Combined, these represent 8.77 billion Disability-Adjusted Life Years (DALYs) when adjusted for morbidity. All estimates include Monte Carlo confidence intervals.
Valuing these lost years at a conservative global Value of a Statistical Life Year (VSLY) of $150,000 (90% CI: $100,384-$198,679)/DALY (the standard normative valuation used in WHO and health economics cost-effectiveness analyses), we find a cumulative economic deadweight loss of approximately $1.32 quadrillion (90% CI: $676 trillion-$2.14 quadrillion) (2024 USD). The study concludes that the societal cost of Type II Regulatory Errors (delayed access to effective therapies) exceeds the averted cost of Type I Regulatory Errors (market access for ineffective therapies) by a factor of 3,389 (90% CI: 1,811-5,734).
3 Scale
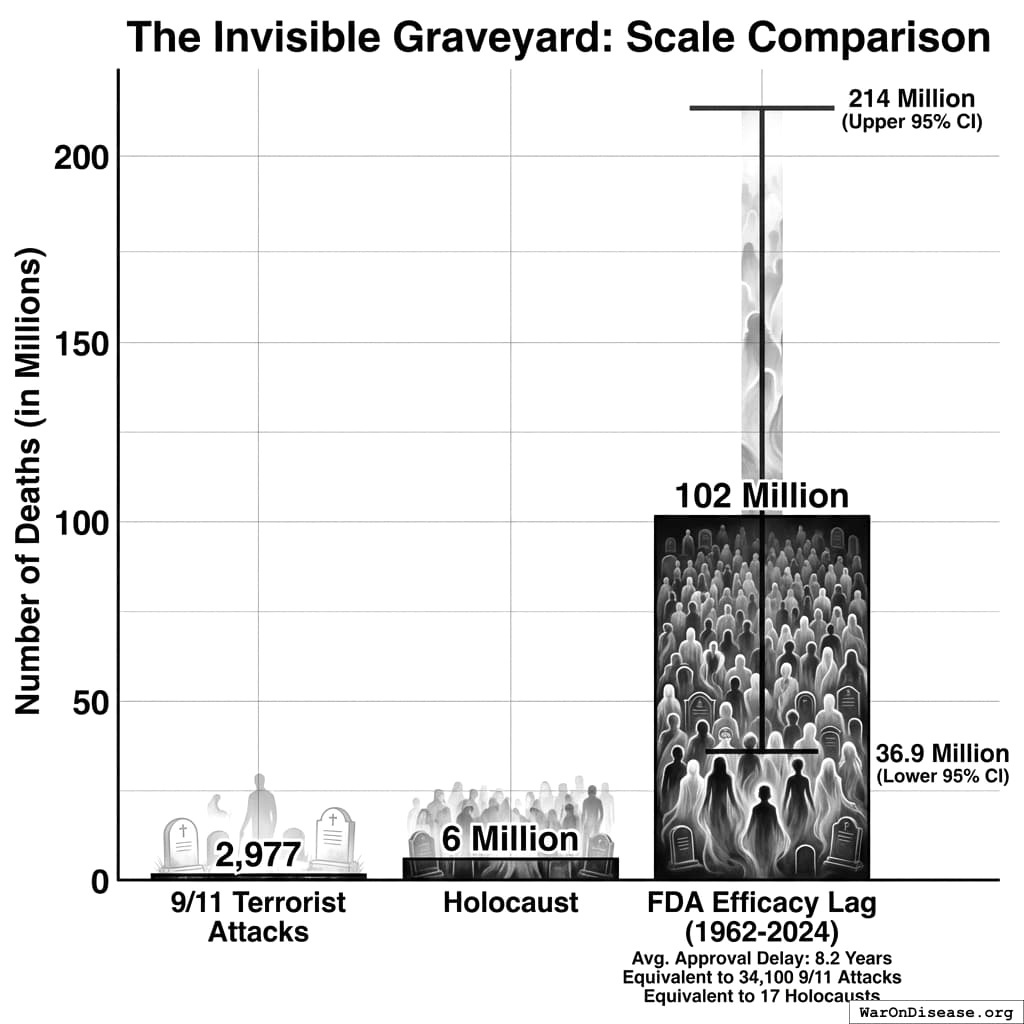
9/11: 2,977 dead. We spent $8 trillion in response.
Holocaust: 6 million dead.
Efficacy lag: 102 million dead. That’s 34,132 9/11s (90% CI: 17,055 9/11s-56,926 9/11s), or 17 Holocausts.
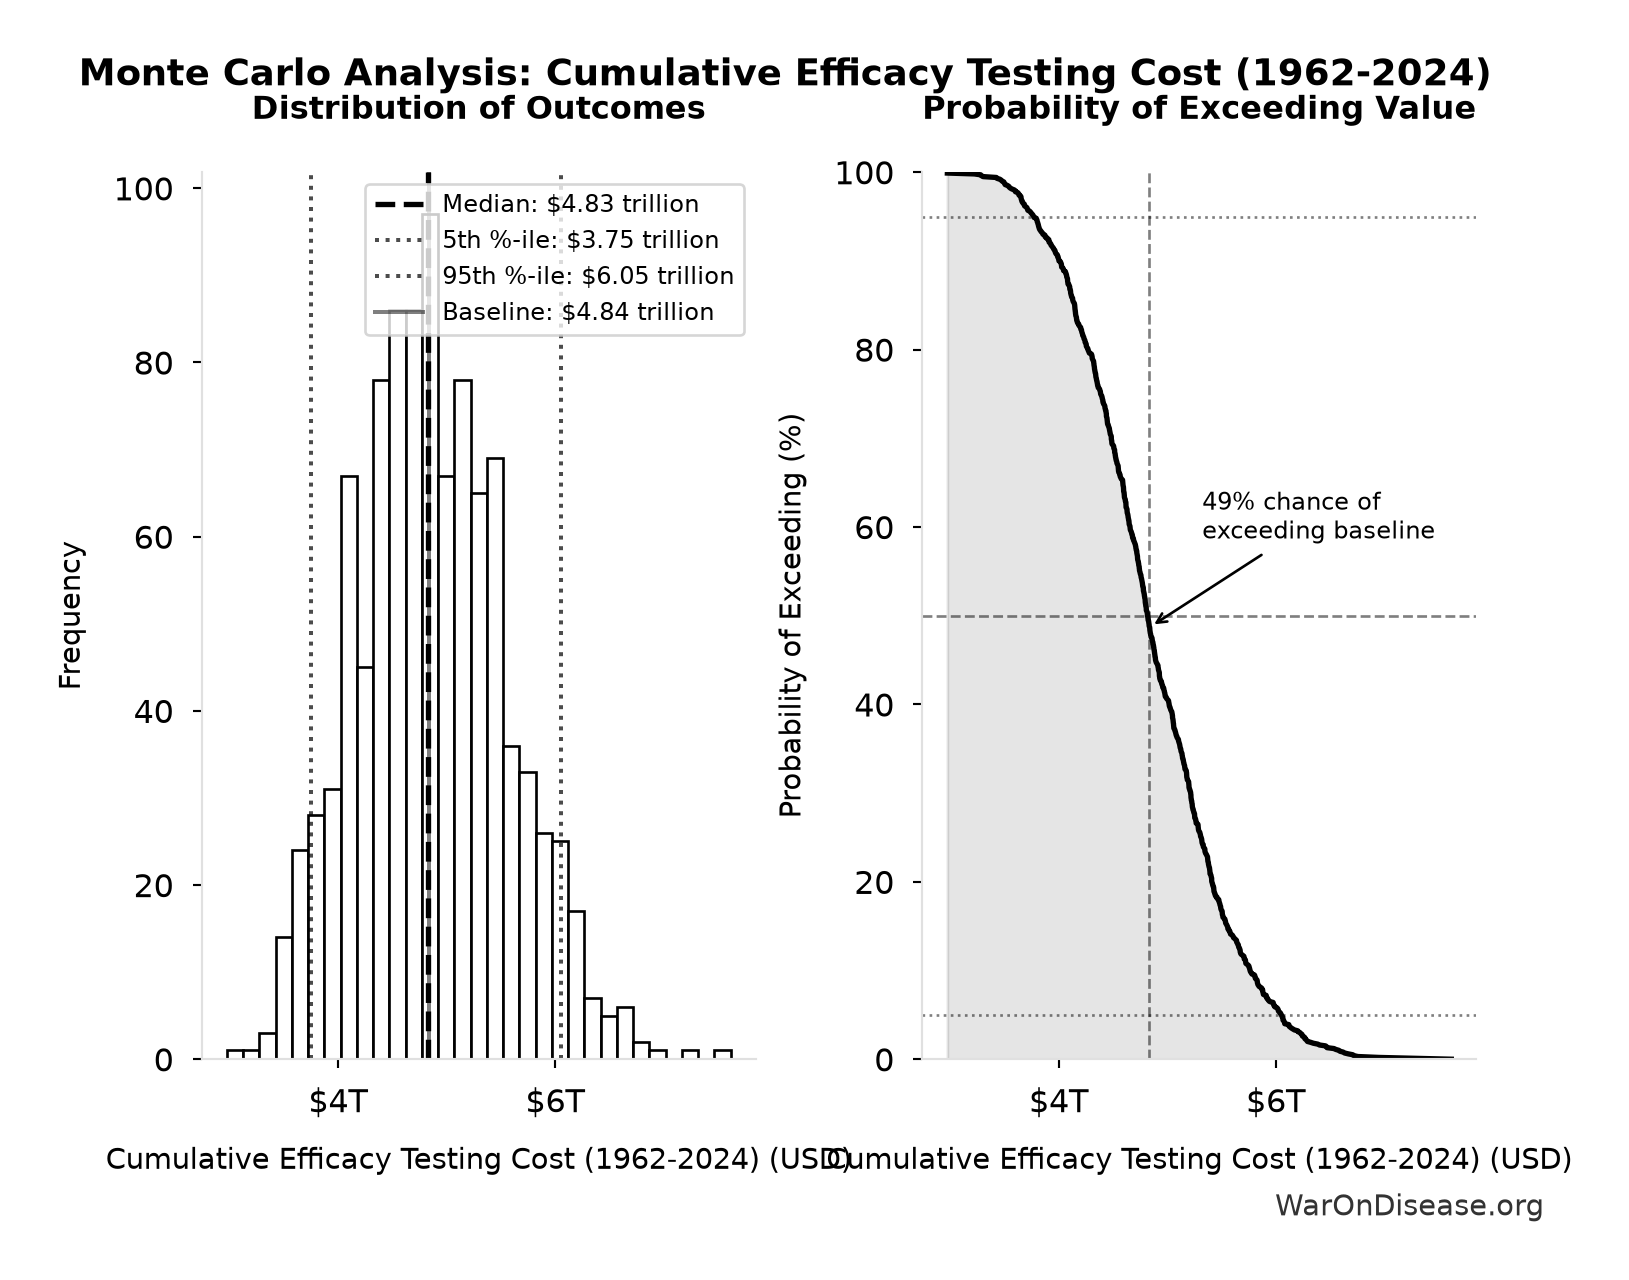
We paid $4.84 trillion (90% CI: $3.75 trillion-$6.05 trillion) (lower bound - Phase 2/3 costs only) to cause 34,132 9/11s (90% CI: 17,055 9/11s-56,926 9/11s).
Simulation Results Summary: Cumulative Efficacy Testing Cost (1962-2024)
| Statistic | Value |
|---|---|
| Baseline (deterministic) | $4.84 trillion |
| Mean (expected value) | $4.86 trillion |
| Median (50th percentile) | $4.83 trillion |
| Standard Deviation | $701 billion |
| 90% Range (5th-95th percentile) | [$3.75 trillion, $6.05 trillion] |
The histogram shows 1,000 of the 10,000 Monte Carlo draws for Cumulative Efficacy Testing Cost (1962-2024); the summary statistics use all 10,000. The exceedance curve (right) shows the probability of the outcome exceeding any given value.
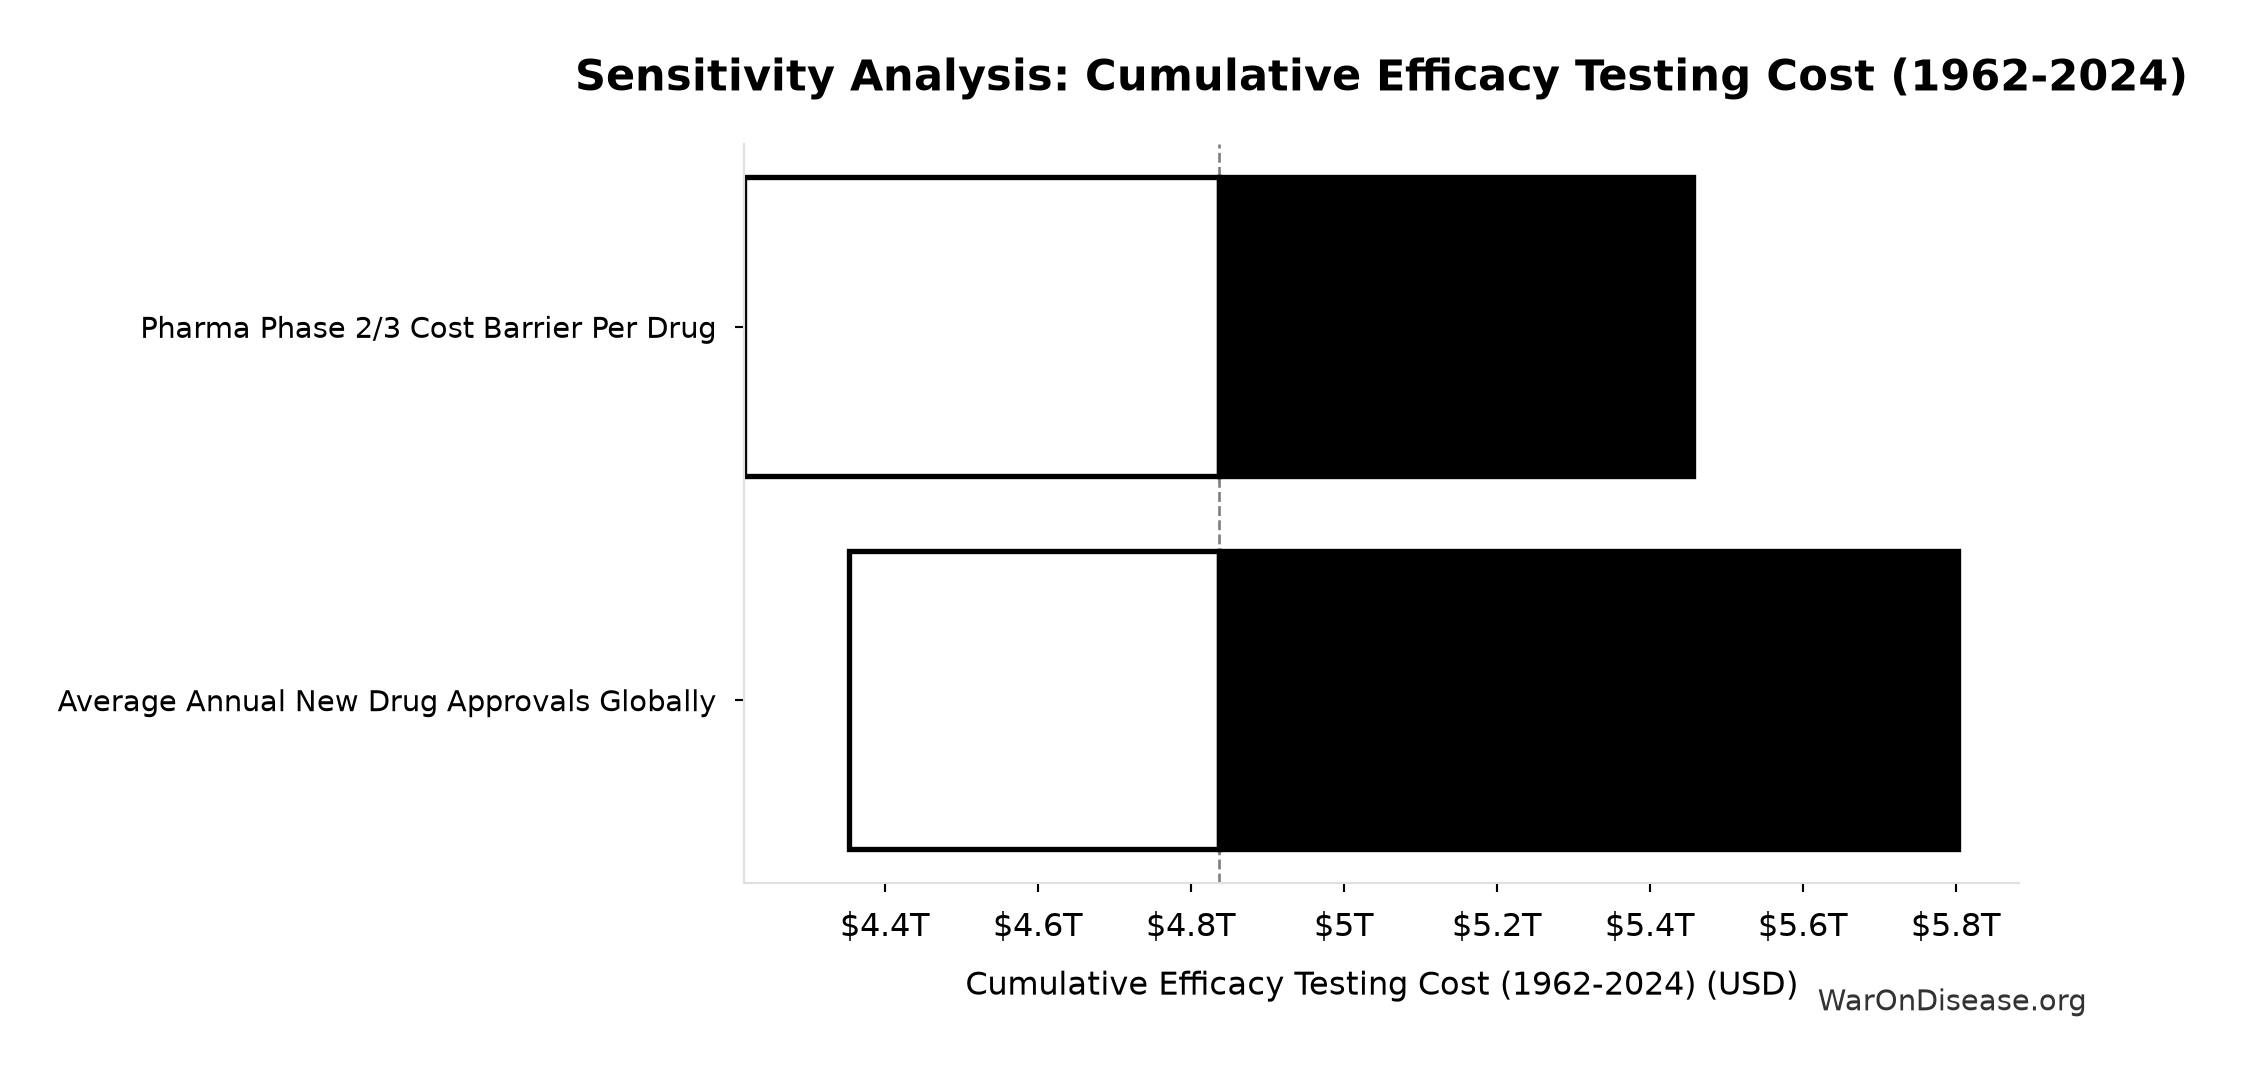
That’s $1.56 billion (90% CI: $1.23 billion-$1.89 billion) per drug for Phase 2/3 efficacy trials, paid by patients through higher drug prices. Before 1962, the AMA’s 144 thousand physicians tracked patient outcomes and JAMA published the results. We replaced that with tiny trials on handpicked patients.
Without mandatory pre-market trials, the market wouldn’t be blind. Knowing whether drugs work is one of the highest consumer demands imaginable. Organizations like Consumer Reports, JAMA, and independent research institutes would compete to provide rigorous, large-scale efficacy data - with no pharma conflicts of interest, across real-world populations, with ongoing monitoring instead of a pre-approval snapshot.
These are underestimates. They only count delays to drugs that got developed. The $2.6 billion (95% CI: $1.5 billion-$4 billion) approval cost killed other drugs before they started. We can’t count deaths prevented by cures that don’t exist.
\[
\begin{gathered}
N_{9/11,equiv} \\
= \frac{Deaths_{lag,total}}{N_{9/11}} \\
= \frac{102M}{2{,}980} \\
= 34{,}100
\end{gathered}
\]
where:
\[
\begin{gathered}
Deaths_{lag,total} \\
= Lives_{saved,annual} \times T_{lag} \\
= 12.4M \times 8.2 \\
= 102M
\end{gathered}
\]
where:
\[
\begin{gathered}
Lives_{saved,annual} \\
= \frac{LY_{saved,annual}}{T_{ext}} \\
= \frac{149M}{12} \\
= 12.4M
\end{gathered}
\]
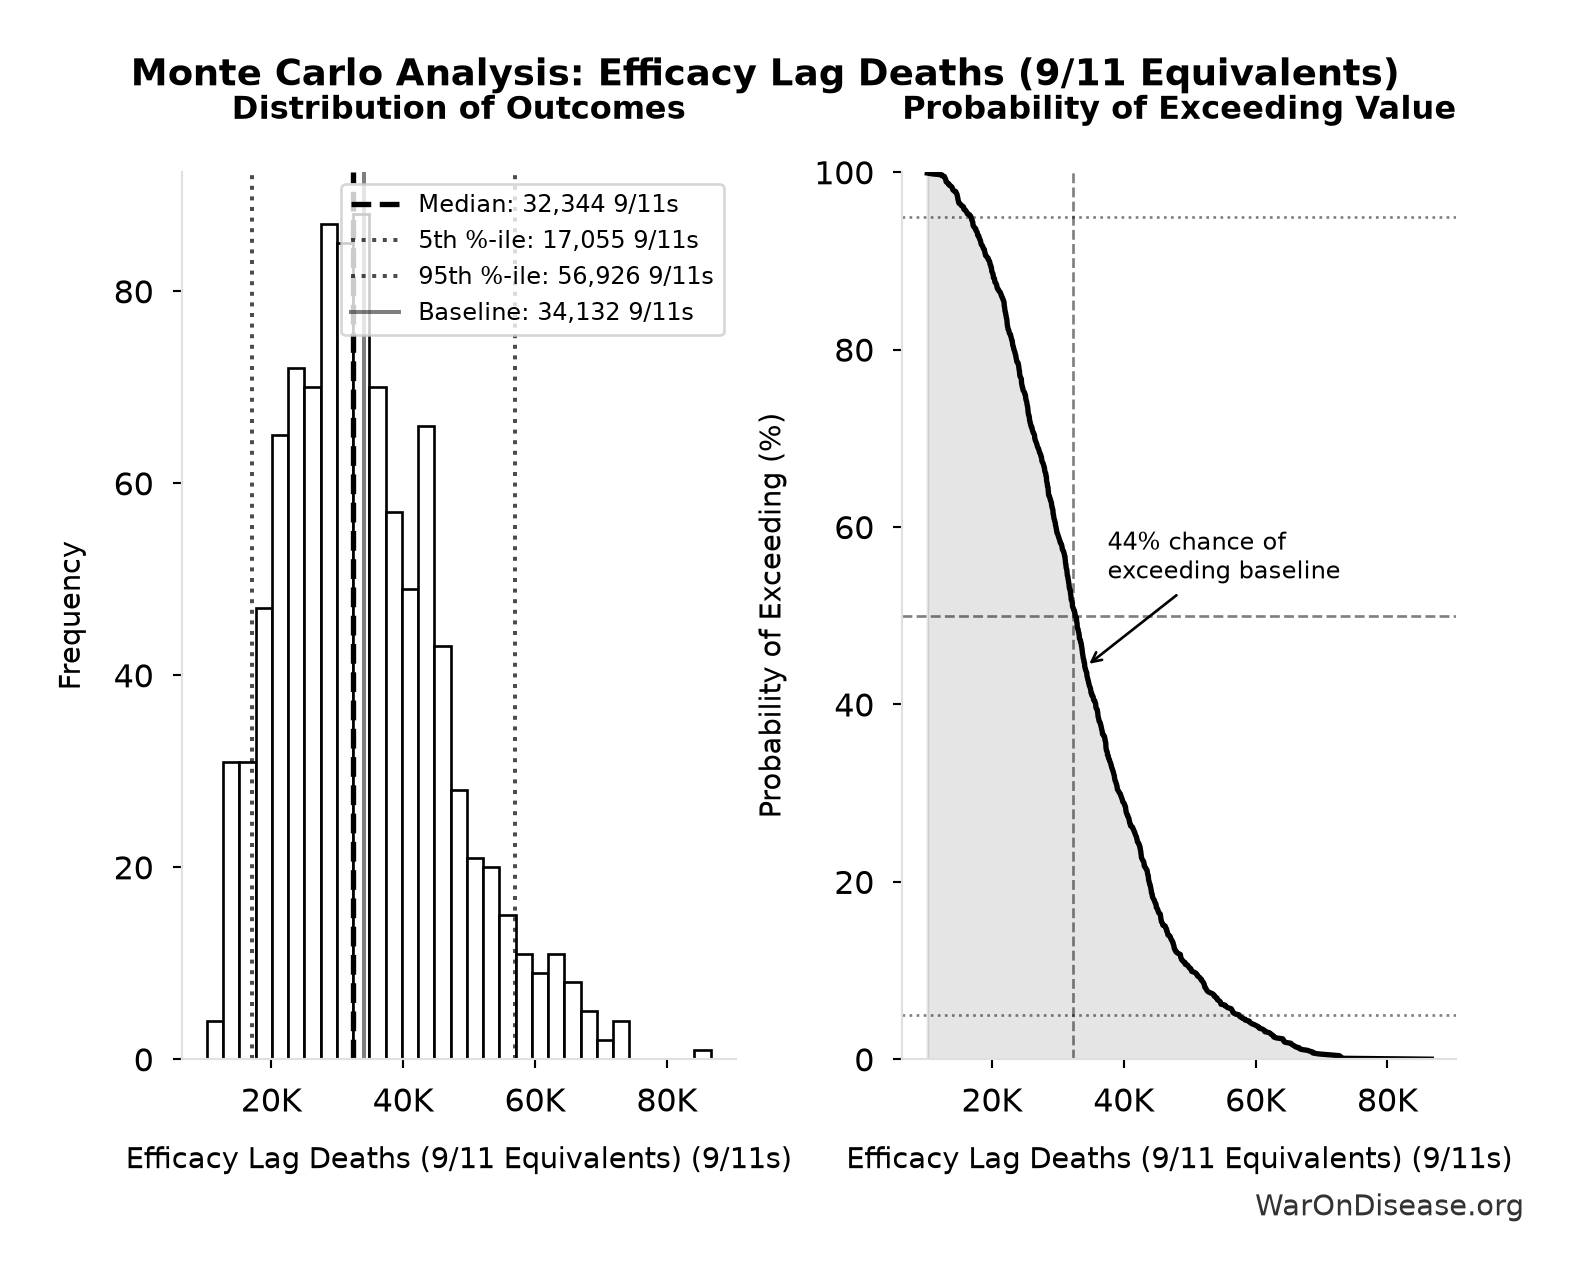
Simulation Results Summary: Efficacy Lag Deaths (9/11 Equivalents)
| Statistic | Value |
|---|---|
| Baseline (deterministic) | 34,132 |
| Mean (expected value) | 34,033 |
| Median (50th percentile) | 32,344 |
| Standard Deviation | 12,202 |
| 90% Range (5th-95th percentile) | [17,055, 56,926] |
The histogram shows 1,000 of the 10,000 Monte Carlo draws for Efficacy Lag Deaths (9/11 Equivalents); the summary statistics use all 10,000. The exceedance curve (right) shows the probability of the outcome exceeding any given value.
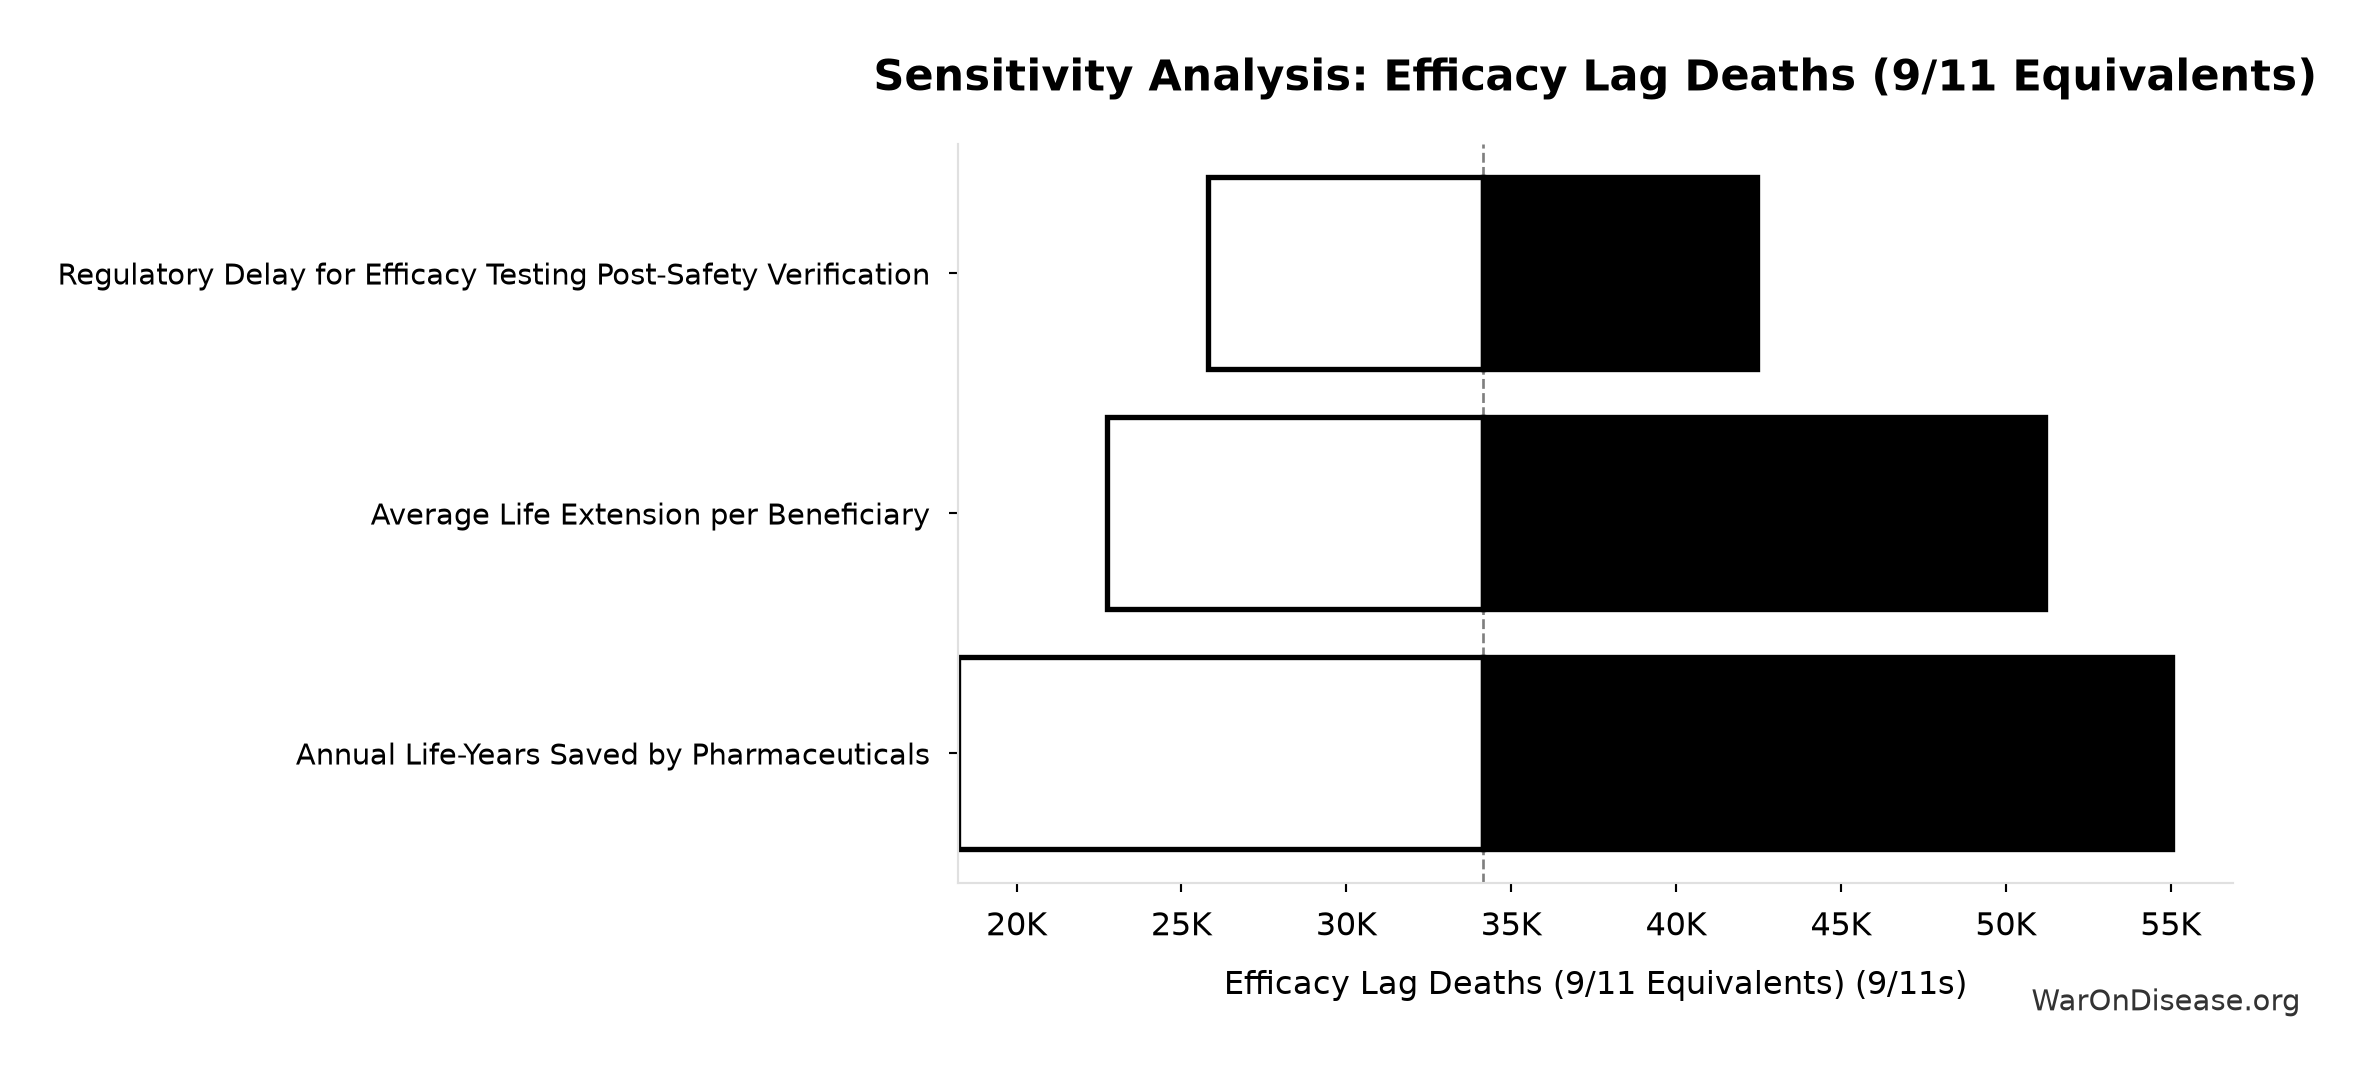
Sensitivity Indices for Efficacy Lag Deaths (9/11 Equivalents)
Regression-based sensitivity showing which inputs explain the most variance in the output.
| Input Parameter | Sensitivity Coefficient | Interpretation |
|---|---|---|
| Total Deaths from Historical Progress Delays (deaths) | 1.0000 | Strong driver |
Interpretation: Standardized coefficients show the change in output (in SD units) per 1 SD change in input. Values near ±1 indicate strong influence; values exceeding ±1 may occur with correlated inputs.
4 Introduction
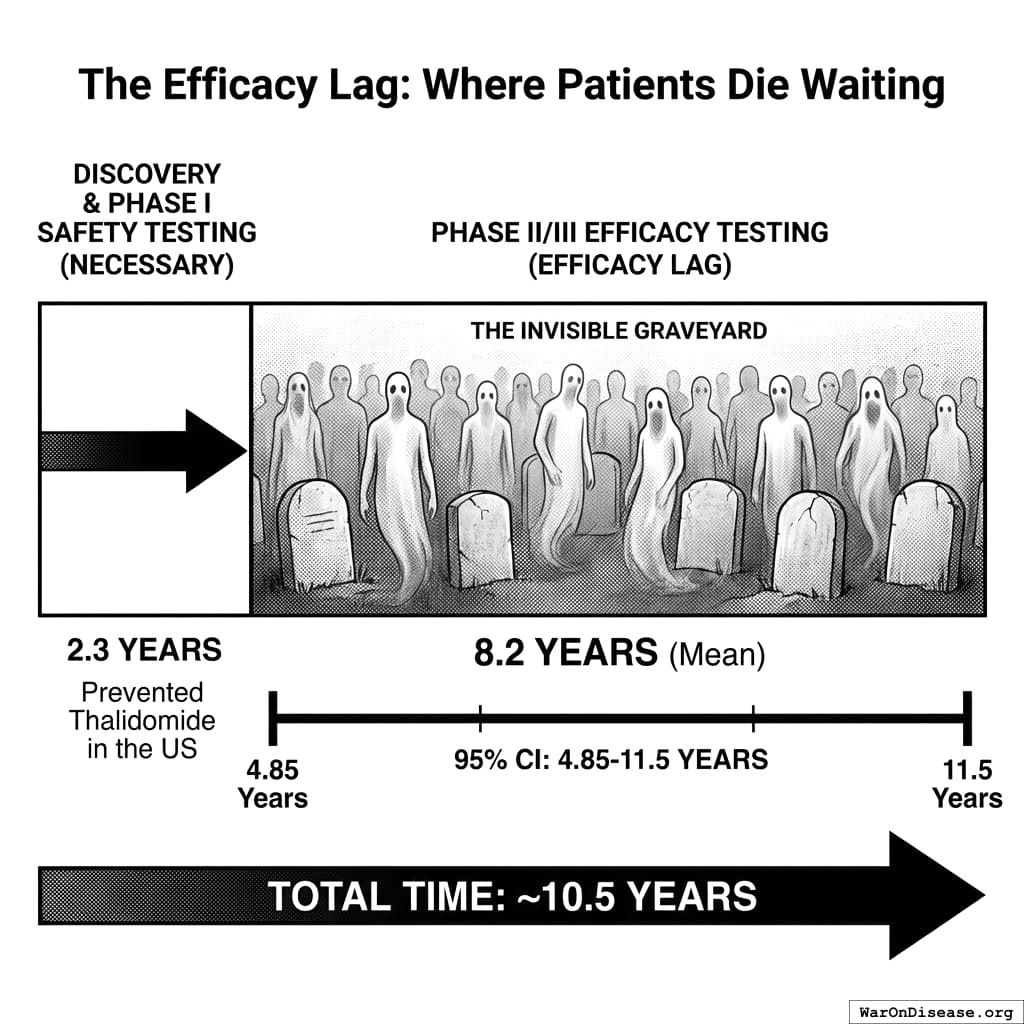
The modern pharmaceutical regulatory model relies on a binary licensure model: a drug is either “safe and effective” (approved) or “unsafe/ineffective” (prohibited). While Phase I trials typically establish safety within 2.3 years, the requirement to prove statistical efficacy (Phase II/III) extends the pre-market timeline by an additional 8.2 years (90% CI: 4.84 years-11.5 years) on average.
This study evaluates the Bifurcated Regulatory Model (BRM), defined as “Safety-First / Efficacy-Later”, to measure the “Invisible Graveyard”: the population that dies during the regulatory latency period between safety verification and final approval.
5 Literature Review: The Drug Lag Debate
5.1 Foundational Economic Analysis
The regulatory cost of FDA efficacy requirements was first rigorously quantified by Peltzman35, who estimated that the 1962 Kefauver-Harris Amendments reduced the flow of new drugs by 50-60%. His analysis concluded that the costs of reduced pharmaceutical innovation substantially exceeded any benefits from keeping ineffective drugs off the market, resulting in net welfare losses to society.
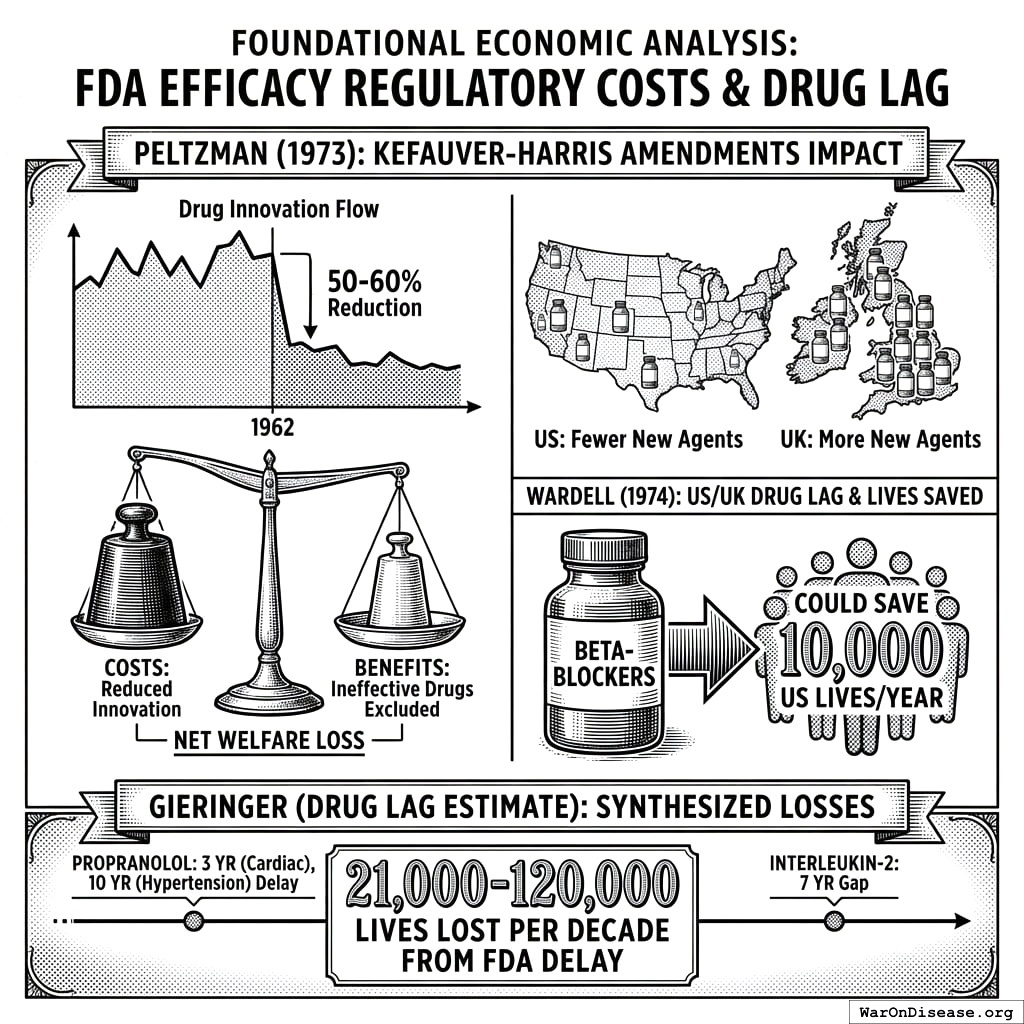
Wardell36 documented the emerging “drug lag” between US and UK drug approvals, finding that the UK had access to significantly more new therapeutic agents. His estimate that beta-blockers alone could save 10,000 American lives annually if approved became a landmark finding in regulatory economics.
Gieringer37 synthesized these estimates, calculating 21,000-120,000 lives lost per decade from FDA delay. His work documented specific drug delays: propranolol (approved in the US 3 years after Europe for cardiac use, 10 years later for hypertension), interleukin-2 (7-year gap), and numerous other therapeutics.
5.2 The Current Debate
Contemporary research continues to find significant regulatory costs. The Tufts Center for the Study of Drug Development documents development timelines of 10.5 years (95% CI: 6 years-12 years) and costs of $2.6 billion (95% CI: $1.5 billion-$4 billion) per approved drug. BIO’s clinical development success rates show only 10% of drugs entering Phase I ultimately reach patients.
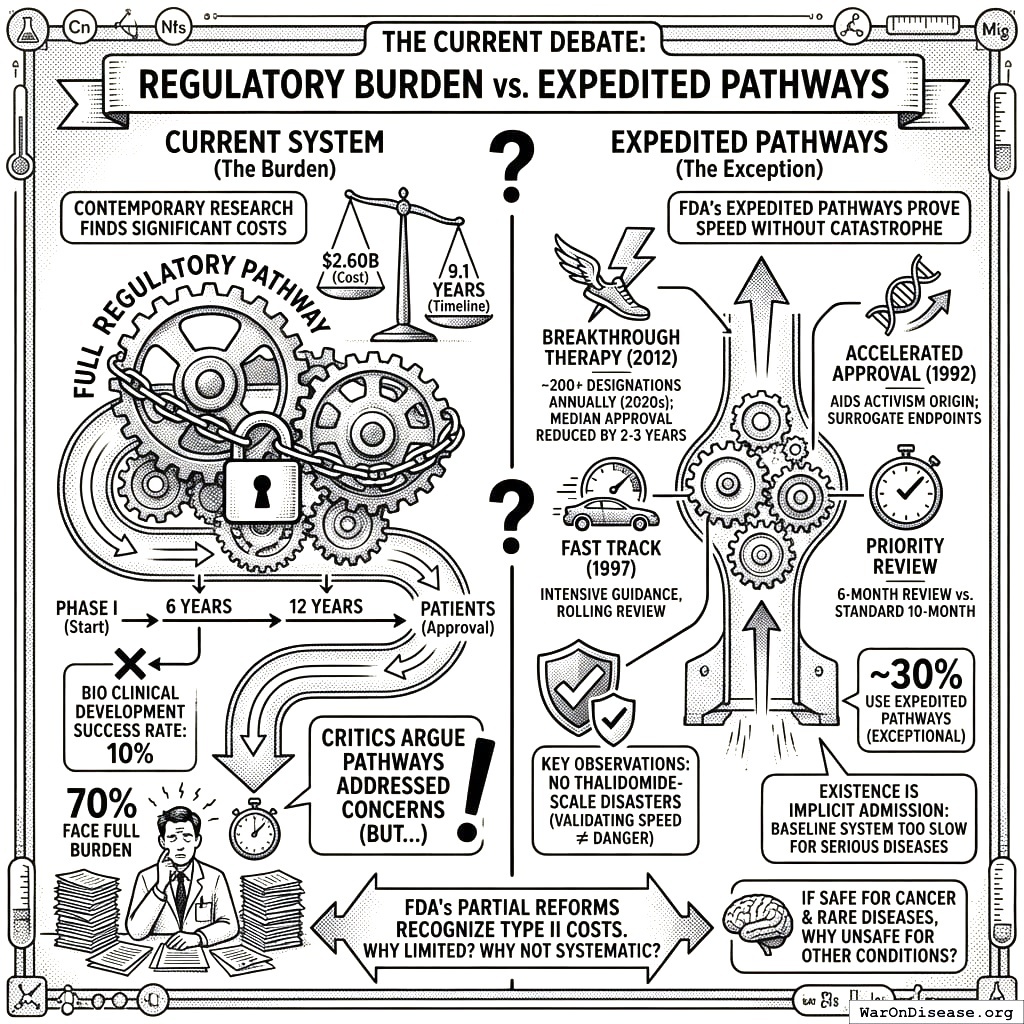
Critics argue that faster approval pathways (breakthrough therapy designation, accelerated approval) have addressed these concerns. However, these pathways actually support our argument:
FDA’s Expedited Pathways Prove Speed is Possible Without Catastrophe:
- Breakthrough Therapy Designation (2012): ~200+ designations annually by 2020s, median approval time reduced by 2-3 years for qualifying drugs
- Accelerated Approval (1992): Born from AIDS activism; allows approval based on surrogate endpoints
- Fast Track (1997): Intensive FDA guidance and rolling review
- Priority Review: 6-month review vs. standard 10-month
Key observations:
- These pathways have NOT produced Thalidomide-scale disasters, validating that speed ≠ danger
- They remain exceptional rather than default: ~30% of approvals use expedited pathways; 70% face full regulatory burden
- Their existence is an implicit admission that the baseline system is too slow for serious diseases
- If expedited pathways are safe for cancer and rare diseases, why are they unsafe for other conditions?
The FDA’s partial reforms prove the system recognizes Type II costs exist. The question is why the recognition is limited to a subset of diseases rather than systematically applied.
5.3 Empirical Case Studies: Demonstrating the Causal Mechanism
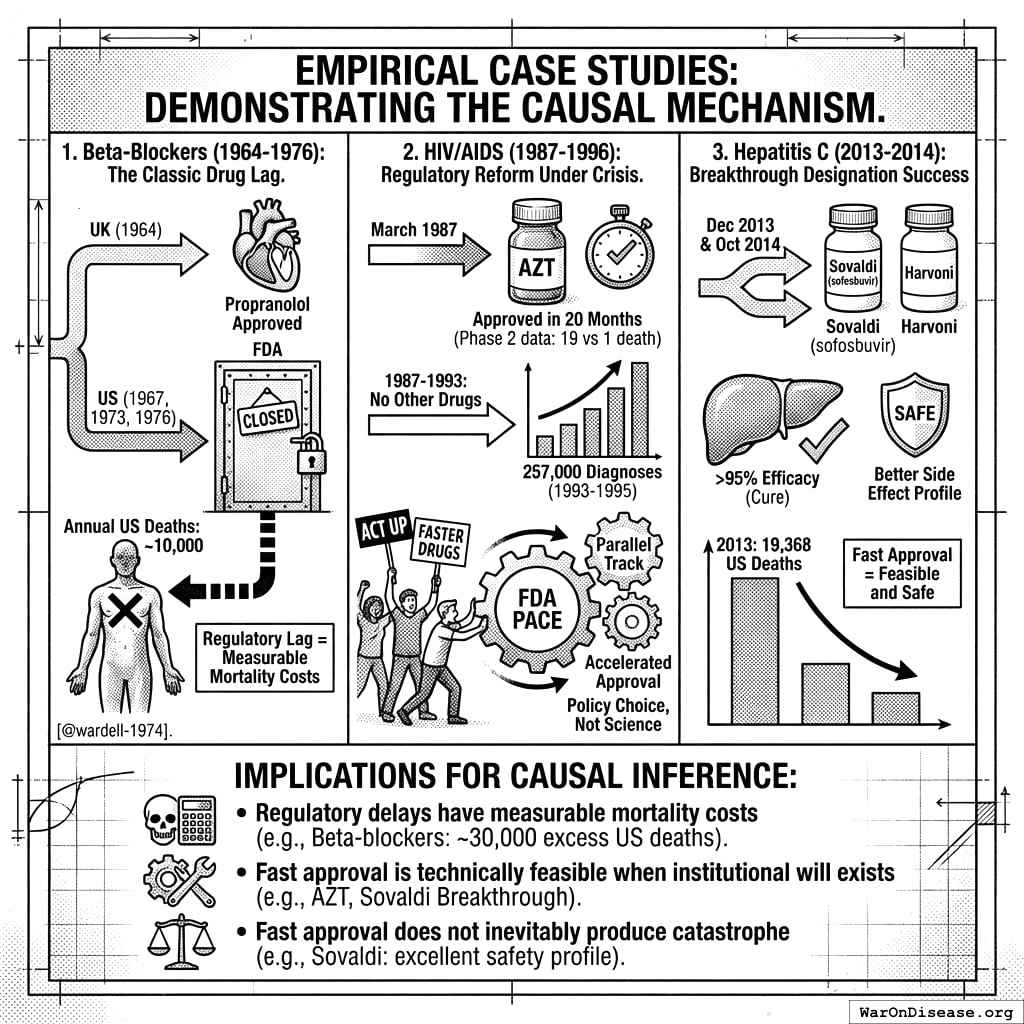
The theoretical claim that regulatory delay causes mortality requires empirical grounding. Three case studies demonstrate the mechanism operates in practice:
1. Beta-Blockers (1964-1976): The Classic Drug Lag
Propranolol, the first beta-blocker for treating angina and hypertension, was approved in the UK in 1964. US approval came in 1967 for minor uses, but not until 1973 (angina) and 1976 (hypertension) for cardiovascular indications. Wardell estimated approximately 10,000 Americans died annually during this delay, as the FDA’s doors were “essentially closed to cardiovascular drugs for an entire decade”36. This single drug’s regulatory lag may have caused more American deaths than all other drug-related deaths in that century.
2. HIV/AIDS (1987-1996): Regulatory Reform Under Crisis
The AIDS epidemic demonstrated that regulatory speed is a policy choice. AZT was approved in March 1987 in a record 20 months, without a Phase 3 trial, after Phase 2 showed 19 placebo deaths vs. 1 treatment death38. This proves expedited approval is technically feasible. However, from 1987-1993, no other AIDS drugs were approved, despite 257,000 diagnoses in 1993-1995 alone. ACT UP activism forced regulatory reforms (Parallel Track, Accelerated Approval), proving that the FDA’s pace reflects institutional priorities, not immutable scientific requirements.
3. Hepatitis C (2013-2014): Breakthrough Designation Success
Sovaldi (sofosbuvir) received FDA Breakthrough Therapy designation and was approved December 2013, with Harvoni following in October 2014. These drugs cure HCV in 12 weeks with >95% efficacy. In 2013, HCV caused 19,368 US deaths. Critically, despite rapid approval, no Thalidomide-scale disaster occurred. The drugs’ side effect profile was actually better than prior interferon-based treatments. This demonstrates that fast approval of life-saving drugs is both possible and safe.
Implications for Causal Inference:
These cases establish that:
- Regulatory delays have measurable mortality costs (beta-blockers: if Wardell’s 10,000/year estimate holds, the 3-year US delay implies ~30,000 excess deaths)
- Fast approval is technically feasible when institutional will exists (AZT: 20 months; Sovaldi: Breakthrough pathway)
- Fast approval does not inevitably produce catastrophe (Sovaldi: excellent safety profile)
The counterfactual is not purely speculative: we observe the mechanism operating in discrete cases where data is available.
6 Methodology & Data
We define the Total Mortality Cost (\(D_{total}\)) as the sum of two distinct variables:
\[ D_{total} = D_{lag} + D_{void} \]
6.1 Variable Definitions
- \(D_{lag}\) (Delay Mortality): Deaths occurring while existing, working drugs are in Phase II/III trials.
- \(D_{void}\) (Innovation Loss): Deaths occurring because high regulatory costs prevented the development of potential cures (The “Innovation Tax”).
6.2 Theoretical Upper Bound: What’s Eventually Preventable?
Before calculating regulatory delay costs, we must establish what percentage of deaths are theoretically preventable with sufficient biomedical advancement. This sets the upper bound for any intervention.
7 Methodological Note: Distinguishing Current vs. Theoretical Preventability
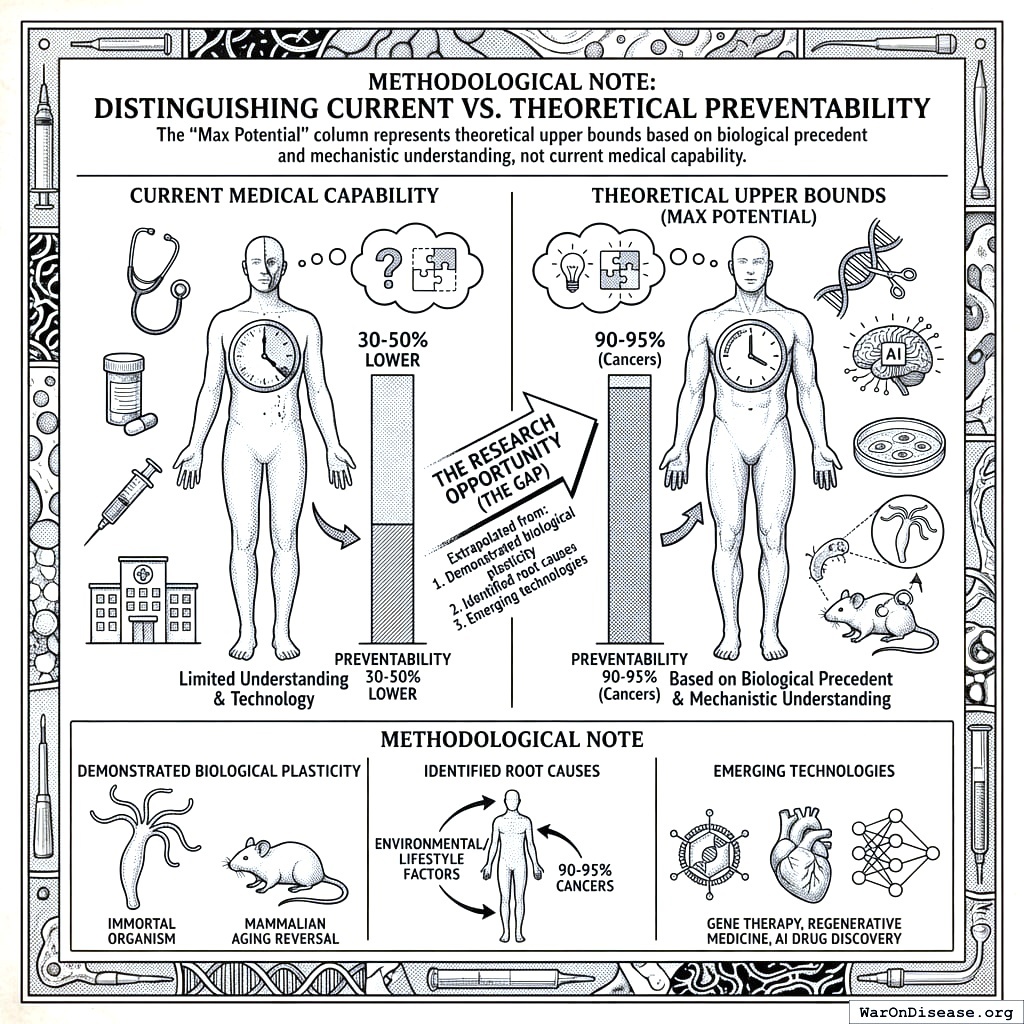
The “Max Potential” column represents theoretical upper bounds based on biological precedent and mechanistic understanding, not current medical capability. These estimates extrapolate from:
- Demonstrated biological plasticity (organisms that don’t age, mammalian aging reversal)
- Identified root causes (90-95% of cancers have environmental/lifestyle roots)
- Emerging technologies (gene therapy, regenerative medicine, AI drug discovery)
Current preventability is typically 30-50% lower than theoretical maximum. The gap represents the research opportunity.
7.0.1 Disease Burden by Category
Using WHO Global Burden of Disease39 data, we categorize annual deaths:
| Category | % of Deaths | Current | Max Potential | Source for Max Estimate |
|---|---|---|---|---|
| Cardiovascular | 26.0% | 50% | 95% | WHO: 80-90% preventable40 |
| Cancer | 18.9% | 69% | 95% | 90-95% environmental/lifestyle roots41 |
| Aging-related | 23.2% | 5% | 99% | Mammalian aging reversal demonstrated42 |
| Accidents | 8.0% | 30% | 60% | WHO: largely preventable43 |
| Metabolic | 6.3% | 70% | 98% | Diabetes reversal via gene therapy441 |
| Respiratory | 4.3% | 60% | 90% | WHO: 80% of COPD preventable2 |
| Neurodegenerative | 3.6% | 10% | 80% | Stem cell therapy potential45 |
| Infectious | 1.9% | 95% | 99% | Vaccines + antimicrobials46 |
| Other | 7.7% | 50% | 95% | Weighted average of above categories3 |
Result: 92.6% (95% CI: 50%-98%) of deaths are eventually avoidable with sufficient research.
7.0.2 Why This Upper Bound? The Biological and Epidemiological Evidence
The “max potential” estimates above are grounded in peer-reviewed research:
- Aging has been reversed in mammals. Yamanaka factor therapy extended remaining lifespan by 109% in aged mice42 and reversed epigenetic age in human skin cells by 30 years. The mechanisms are understood; we lack only the engineering to apply them safely in humans.
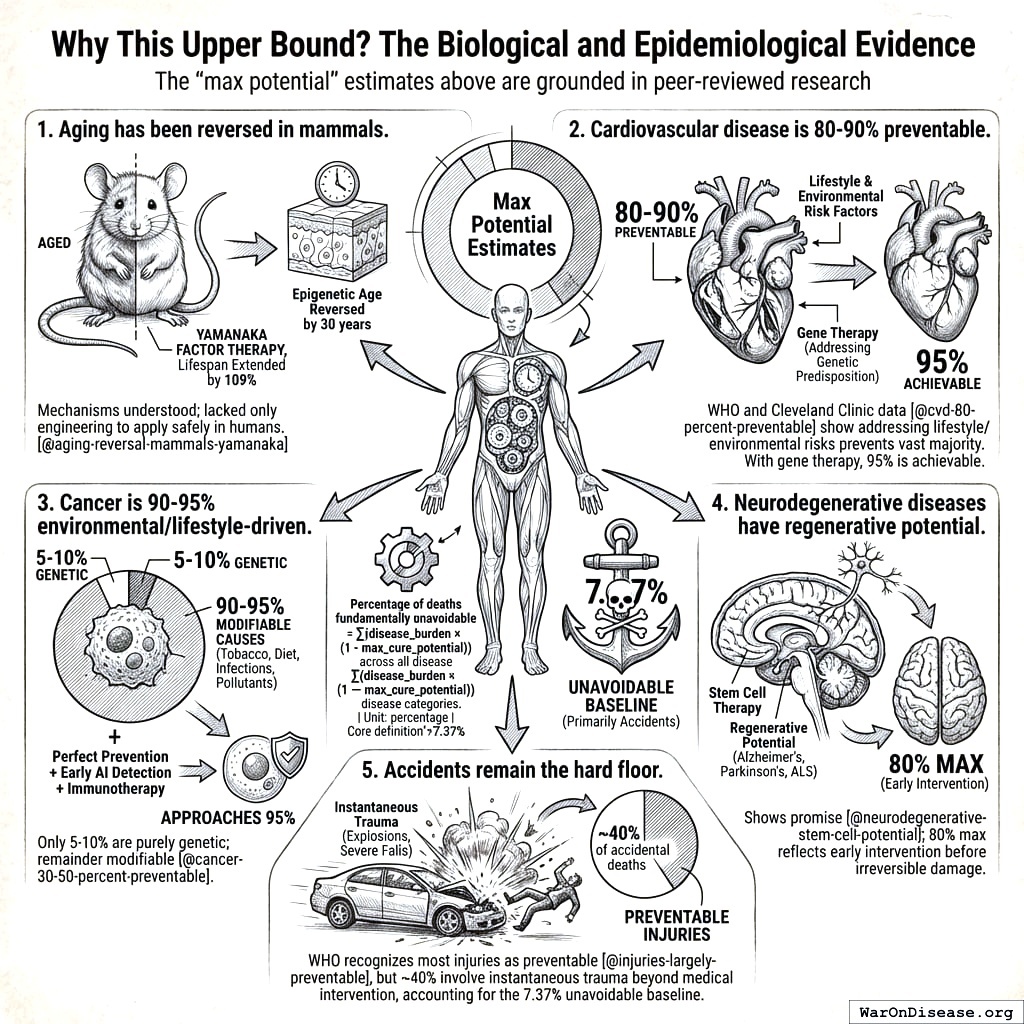
Cardiovascular disease is 80-90% preventable. WHO and Cleveland Clinic data40 show that addressing lifestyle and environmental risk factors prevents the vast majority of heart attacks and strokes. With gene therapy addressing genetic predisposition, 95% is achievable.
Cancer is 90-95% environmental/lifestyle-driven. Only 5-10% of cancers are purely genetic41; the remainder have modifiable causes (tobacco, diet, infections, pollutants). Perfect prevention + early AI detection + immunotherapy approaches 95%.
Neurodegenerative diseases have regenerative potential. Stem cell therapy shows promise45 for Alzheimer’s, Parkinson’s, and ALS. The 80% max reflects early intervention before irreversible damage.
Accidents remain the hard floor. WHO recognizes most injuries as preventable43, but ~40% of accidental deaths involve instantaneous trauma (explosions, severe falls) beyond any medical intervention. This accounts for the 7.37% unavoidable baseline.
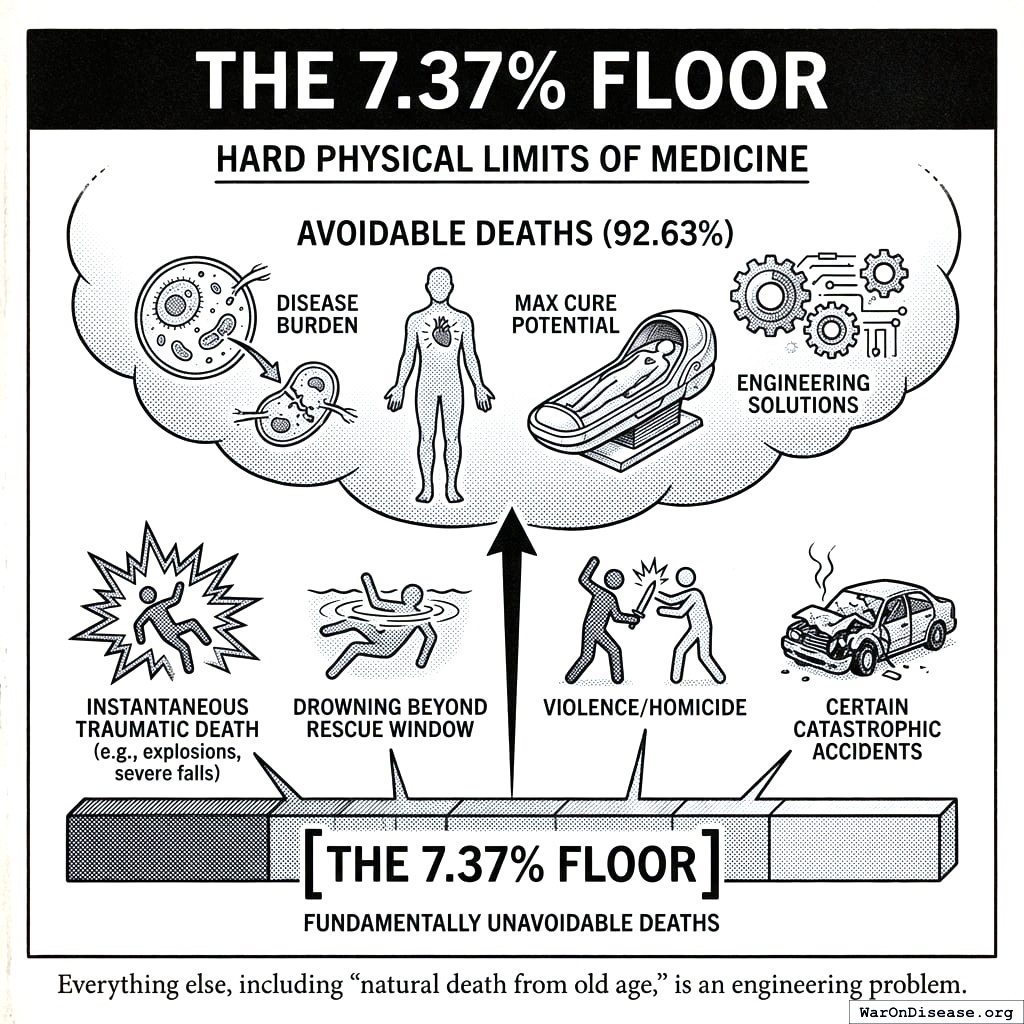
7.0.3 The 7.37% Floor
The remaining deaths are fundamentally unavoidable even with perfect biotechnology:
- Instantaneous traumatic death (e.g., explosions, severe falls)
- Drowning beyond rescue window
- Violence/homicide
- Certain catastrophic accidents
These represent the hard physical limits of medicine. Everything else, including “natural death from old age,” is an engineering problem with engineering solutions.
7.1 Data Sources & Parameterization
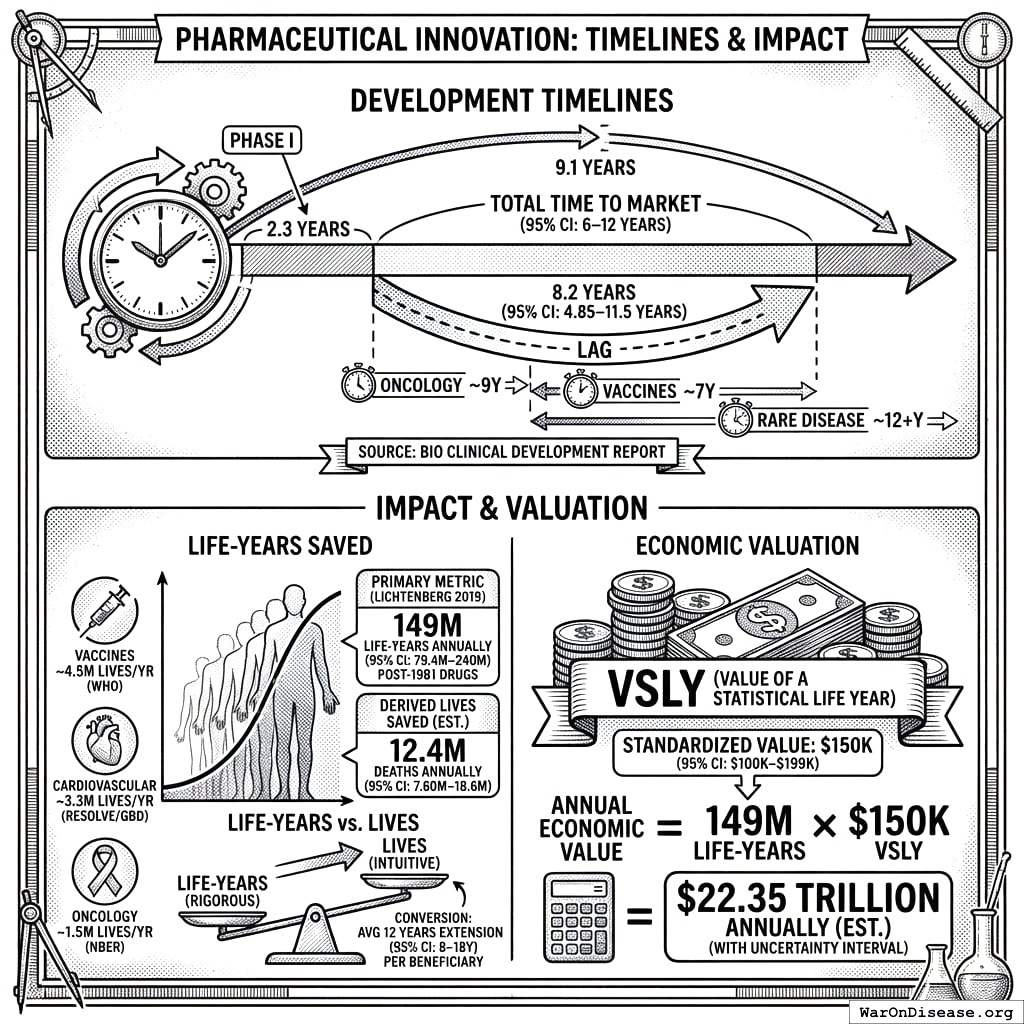
Development Timelines: Biotechnology Innovation Organization (BIO) Clinical Development Success Rates 2011–2020.
- Verified Metric: Phase I duration = 2.3 years. Total Time to Market = 10.5 years (95% CI: 6 years-12 years). Lag = 8.2 years (90% CI: 4.84 years-11.5 years) - wide variance by therapeutic area (oncology ~9y, vaccines ~7y, rare disease ~12+y).
- Source: BIO.org Clinical Development Report11
Pharmaceutical Impact (Life-Years Saved): Primary source: Lichtenberg (2019)21.
- Primary metric: 149 million life-years (95% CI: 79.4 million life-years-240 million life-years) saved annually by post-1981 drugs (22 countries, 66 diseases)
- Methodology: 3-way fixed-effects regression (disease-country-year) controlling for confounders
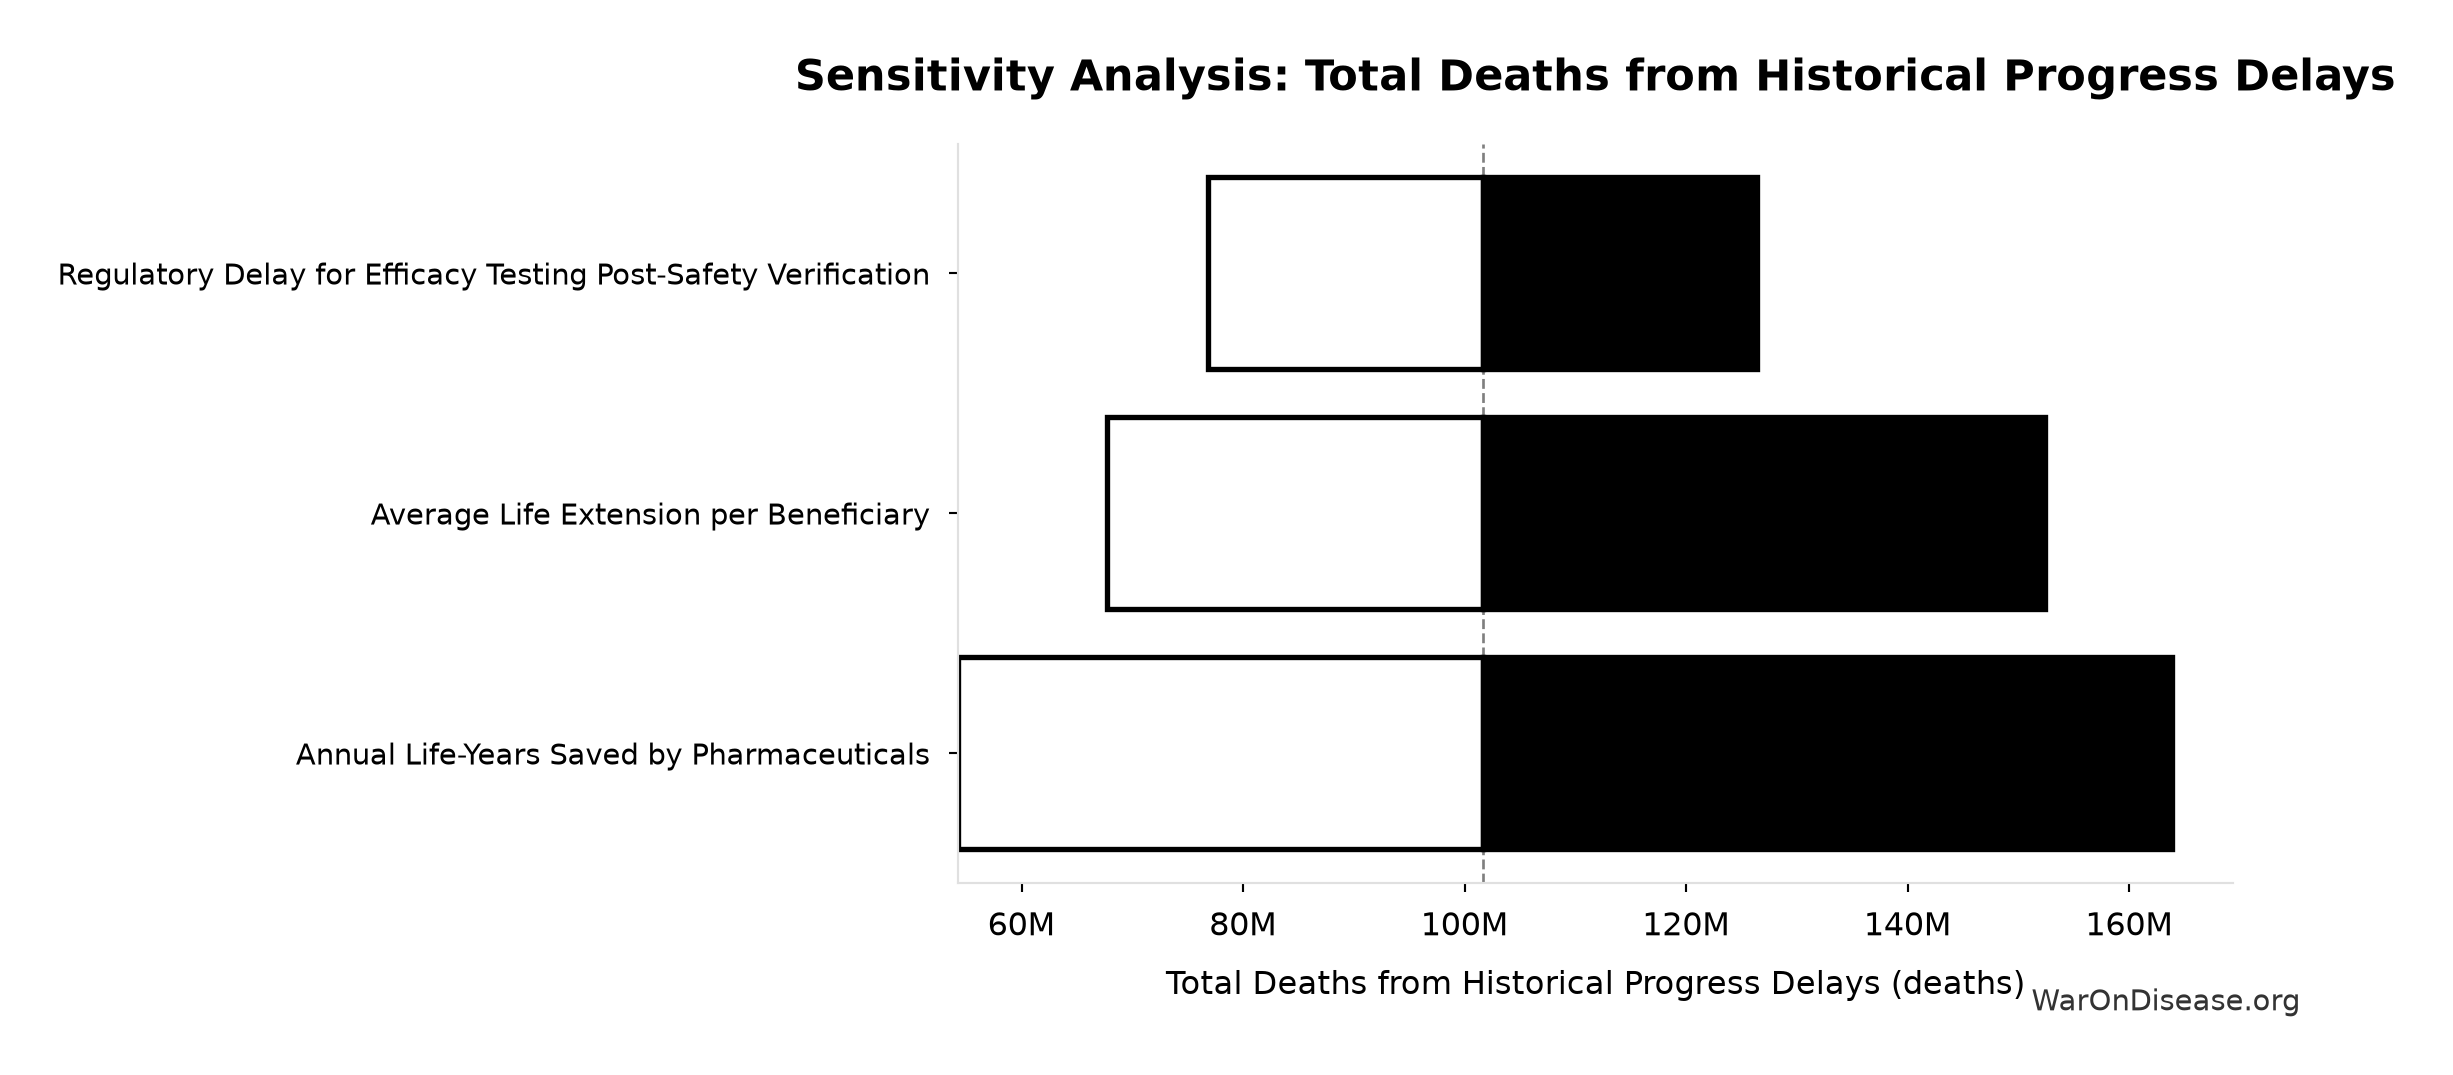
- Derived lives saved: 12.4 million (assuming 12 years (95% CI: 8 years-18 years) average life extension per beneficiary)
7.2 Note
8 Life-Years vs. Lives
Lichtenberg measured life-years saved, not lives. Converting to “lives” requires assuming average life extension per beneficiary (12 years (95% CI: 8 years-18 years)). Life-years is the more rigorous metric; lives is used for intuitive communication. The uncertainty in the conversion is reflected in the confidence intervals.
Supporting evidence (approximate, for context):
- Vaccines: ~4.5M lives/year (WHO estimates 154M lives saved over 50 years)46
- Cardiovascular: ~3.3M lives/year (Resolve to Save Lives / GBD Data)
- Oncology: ~1.5M lives/year (NBER longevity studies)
Economic Valuation: Standard QALY Valuation.
- VSLY (Value of a Statistical Life Year): Standardized at $150,000 (90% CI: $100,384-$198,679) (consistent with project-wide QALY valuations).
8.1 Uncertainty Quantification Methodology
This analysis employs Probabilistic Sensitivity Analysis (PSA) via Monte Carlo simulation to propagate parameter uncertainty through all calculations.
Distribution Selection:
- Normal: Symmetric uncertainty around point estimates (e.g., trial duration)
- Lognormal: Right-skewed, strictly positive values (costs, relative risks)
- Beta: Bounded probabilities [0,1] (success rates, adoption rates)
- Triangular: When only min/mode/max available from literature
Propagation Method:
- Sample N=10,000 draws from each input parameter’s distribution
- Recompute all derived parameters for each Monte Carlo draw
- Report median and 95% credible intervals (2.5th-97.5th percentiles)
Sensitivity Analysis:
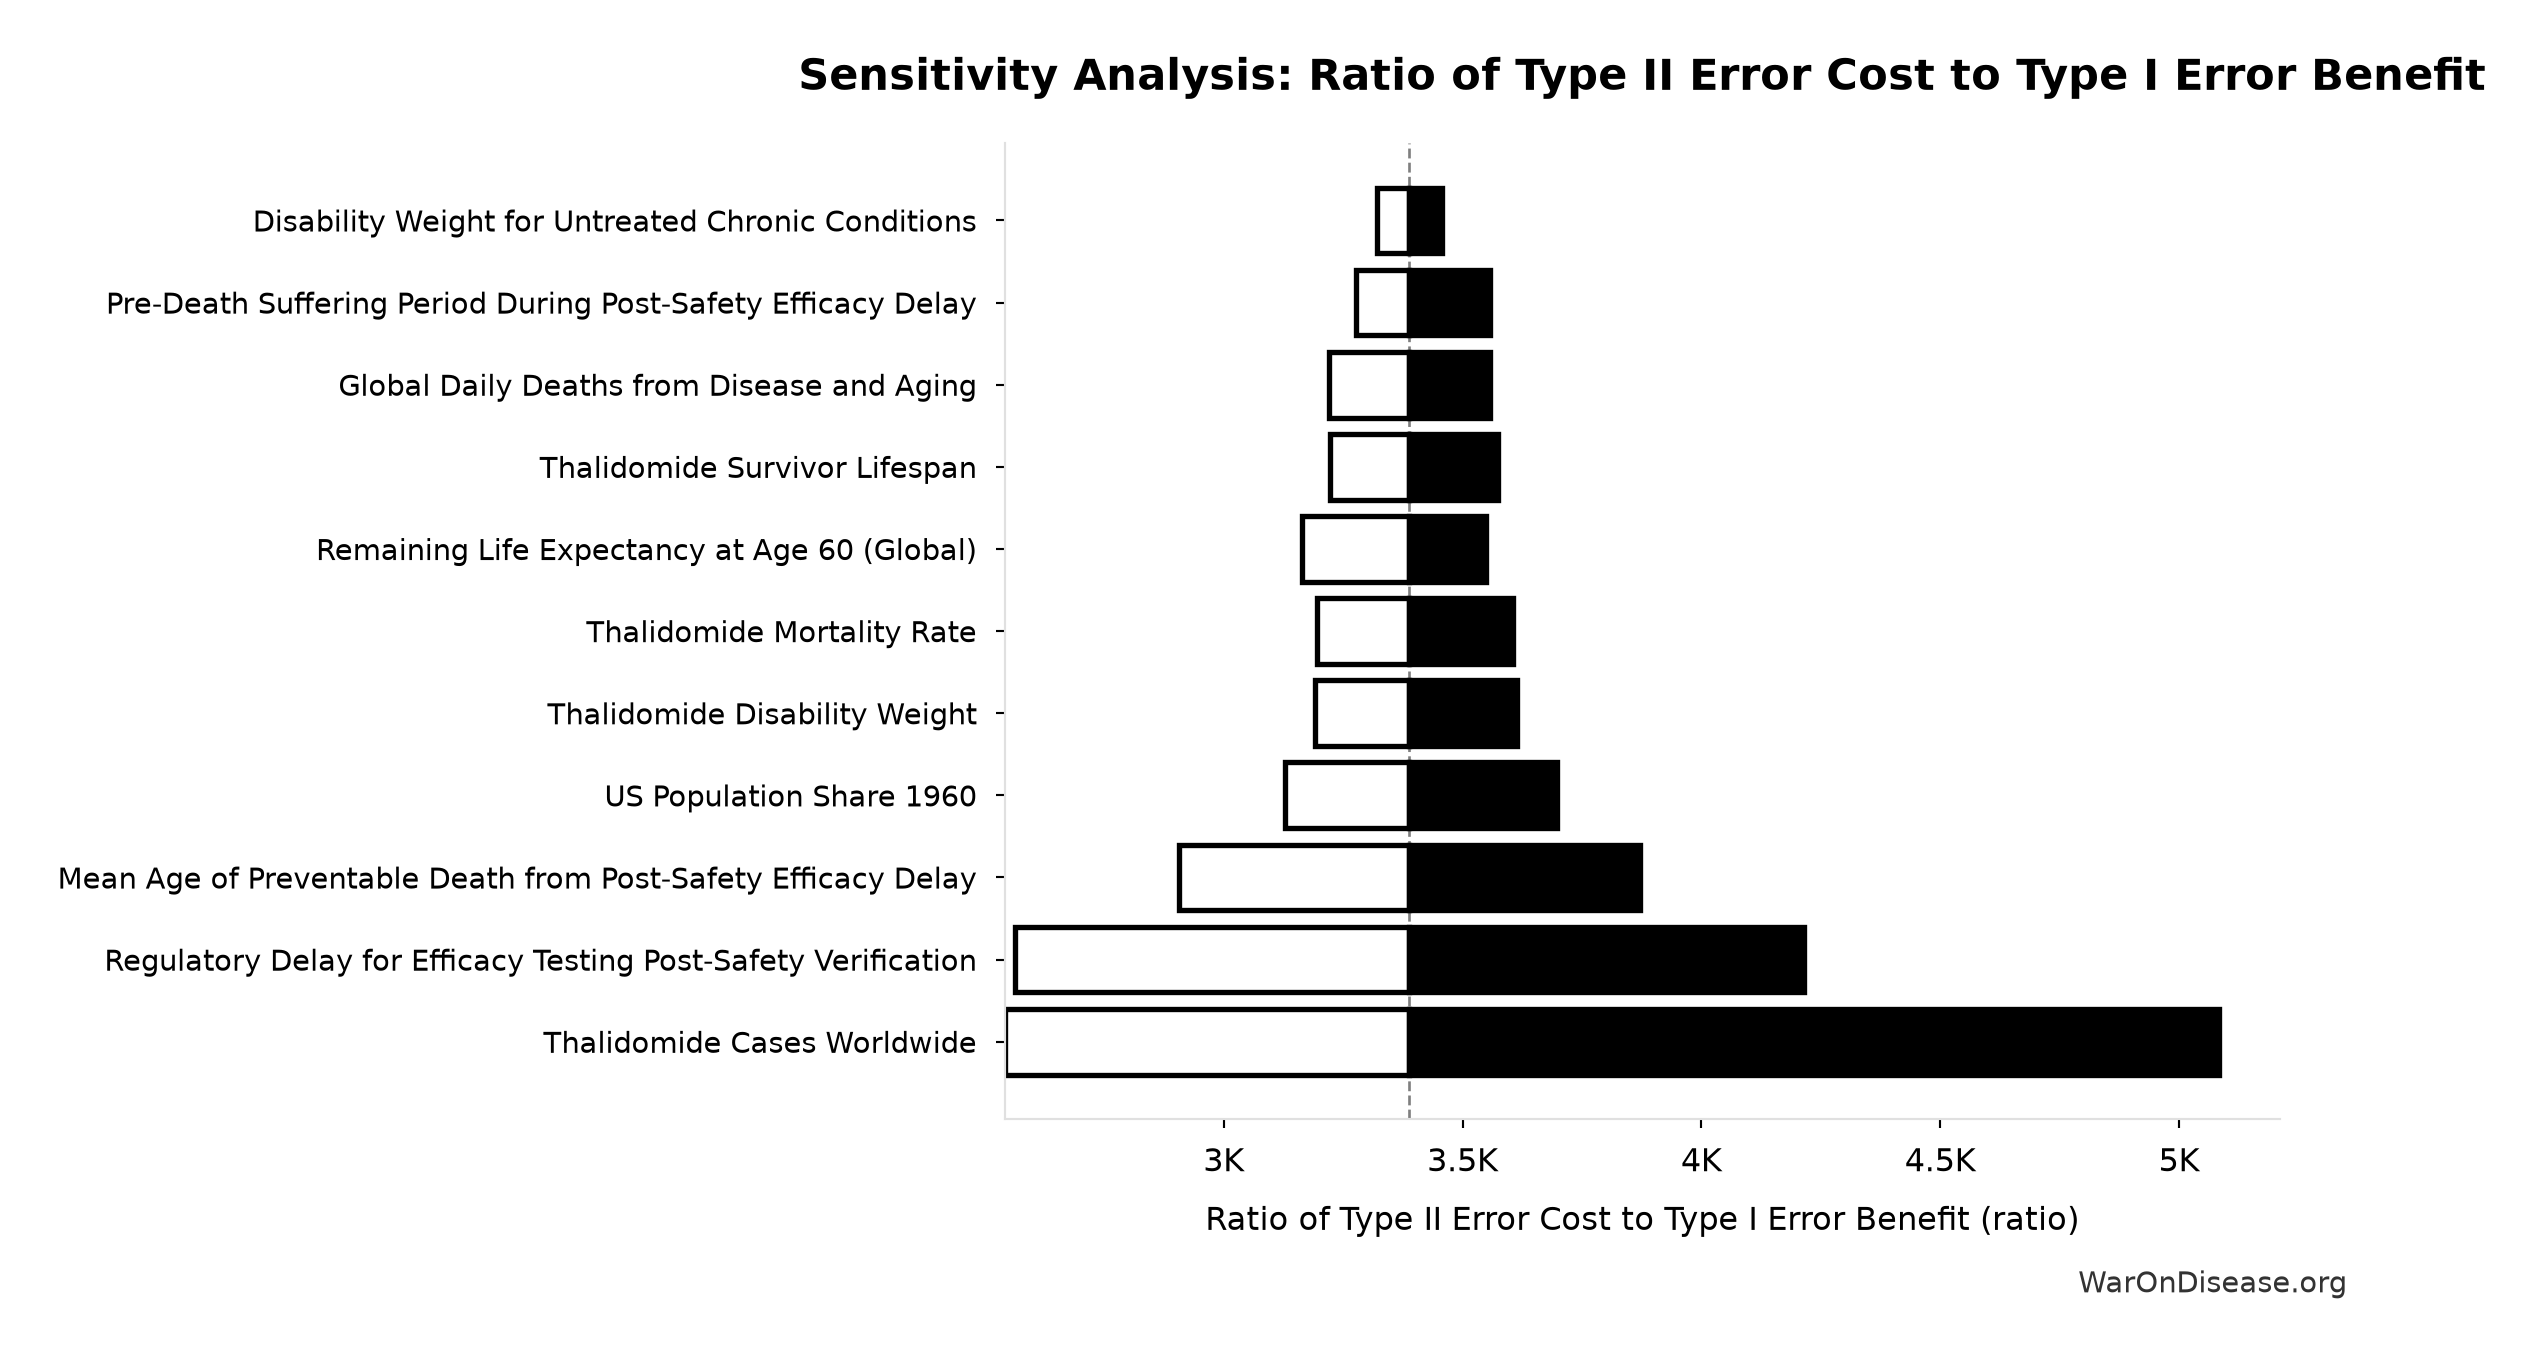
Tornado charts identify which input parameters drive outcome uncertainty by varying each parameter ±1 standard deviation while holding others at baseline. Standardized regression coefficients (β*) enable comparison across parameters with different units.
See Parameters & Calculations Appendix for complete parameter distributions, formulas, and sensitivity analyses for each calculated value.
9 Results: The Mortality Burden
9.1 Primary Estimate
Important Clarification: Throughout this analysis, “regulatory delay” refers specifically to the post-safety efficacy testing delay - the period AFTER safety has been established but BEFORE efficacy approval is granted under current FDA/EMA requirements. This is distinct from safety testing (Phase I), which we consider necessary and effective (as demonstrated by the thalidomide case where safety testing prevented thousands of U.S. deaths).
10 Methodological Caveat: Cascade Assumption
The primary estimate assumes that the 8.2 years (90% CI: 4.84 years-11.5 years) regulatory delay cascades fully through the biomedical research timeline - i.e., that delaying Drug A by 8.2 years (90% CI: 4.84 years-11.5 years) also delays all downstream research that builds on Drug A’s findings by approximately the same amount. This “full cascade” assumption represents a theoretical upper bound. In practice, parallel research tracks, international approvals, and adaptive innovation may partially mitigate cascade effects.
The assumption is not empirically validated at the aggregate level, though individual case studies (beta-blockers, HIV/AIDS, Hepatitis C) demonstrate the mechanism operates in specific instances. The Type II/Type I ratio remains robust even under substantially reduced cascade assumptions (see sensitivity analysis showing the conclusion holds at 10% regulatory attribution).
| Metric | Estimate | Methodology |
|---|---|---|
| Total Deaths | 416 million | Regulatory delay shifts disease eradication timeline by 8.2 years (90% CI: 4.84 years-11.5 years). Uses WHO global disease mortality rate (150,000/day). |
Finding: The disease eradication delay model estimates 416 million total eventually avoidable deaths, with 150,000 per day, greater than the combined casualties of World War I and World War II over the 62-year period.
\[ \begin{gathered} Deaths_{lag} \\ = T_{lag} \times Deaths_{disease,daily} \times 338 \\ = 8.2 \times 150{,}000 \times 338 \\ = 416M \end{gathered} \]
10.0.1 Sensitivity Analysis
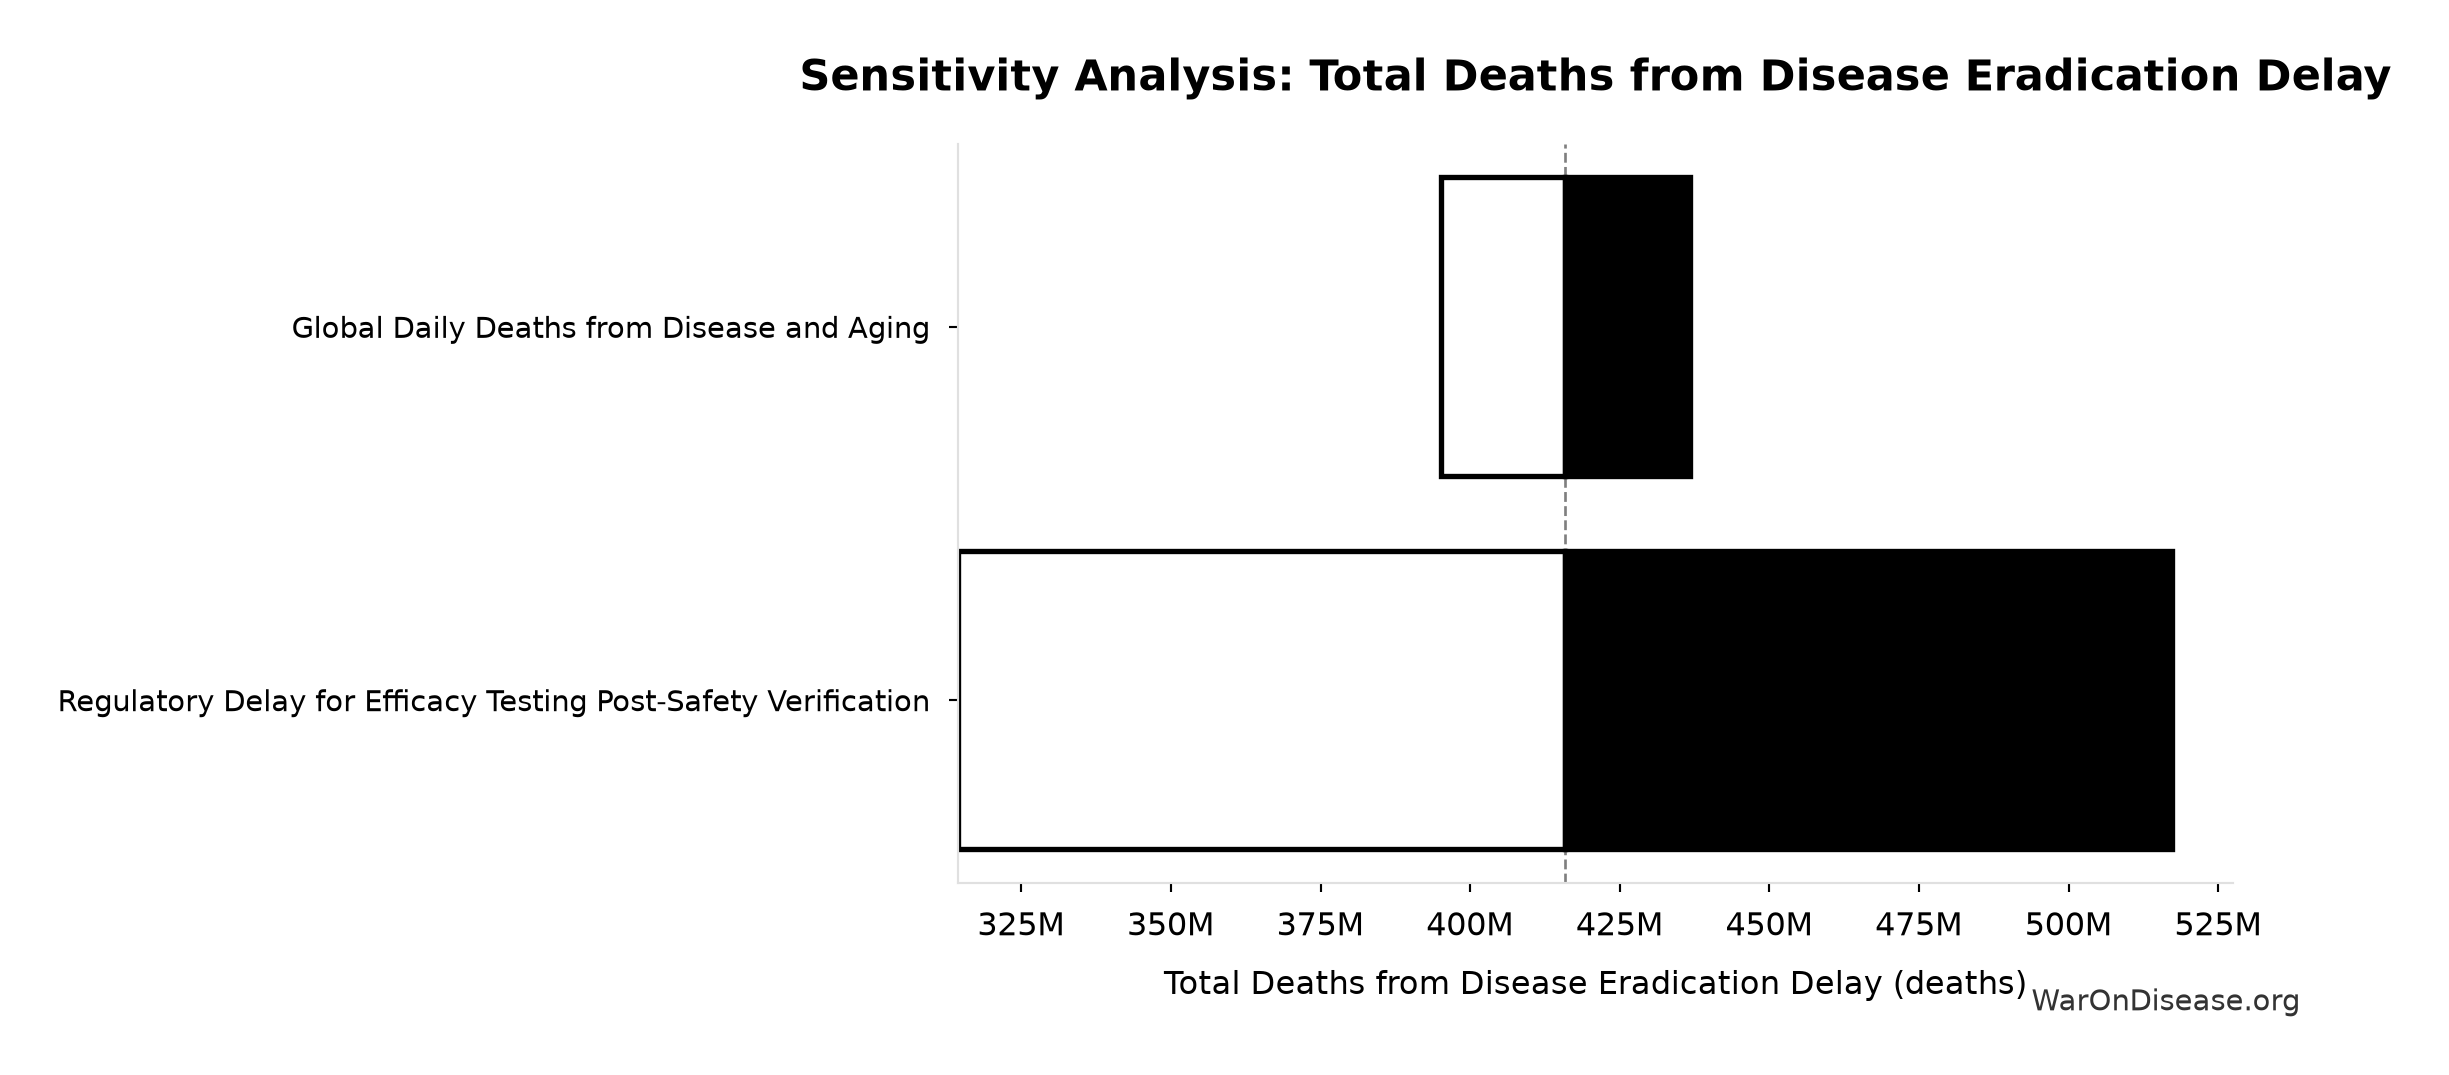
Sensitivity Indices for Total Deaths from Disease Eradication Delay
Regression-based sensitivity showing which inputs explain the most variance in the output.
| Input Parameter | Sensitivity Coefficient | Interpretation |
|---|---|---|
| Regulatory Delay for Efficacy Testing Post-Safety Verification (years) | 0.9809 | Strong driver |
| Global Daily Deaths from Disease and Aging (deaths/day) | 0.2015 | Weak driver |
Interpretation: Standardized coefficients show the change in output (in SD units) per 1 SD change in input. Values near ±1 indicate strong influence; values exceeding ±1 may occur with correlated inputs.
11 Morbidity Analysis: DALYs and QALYs
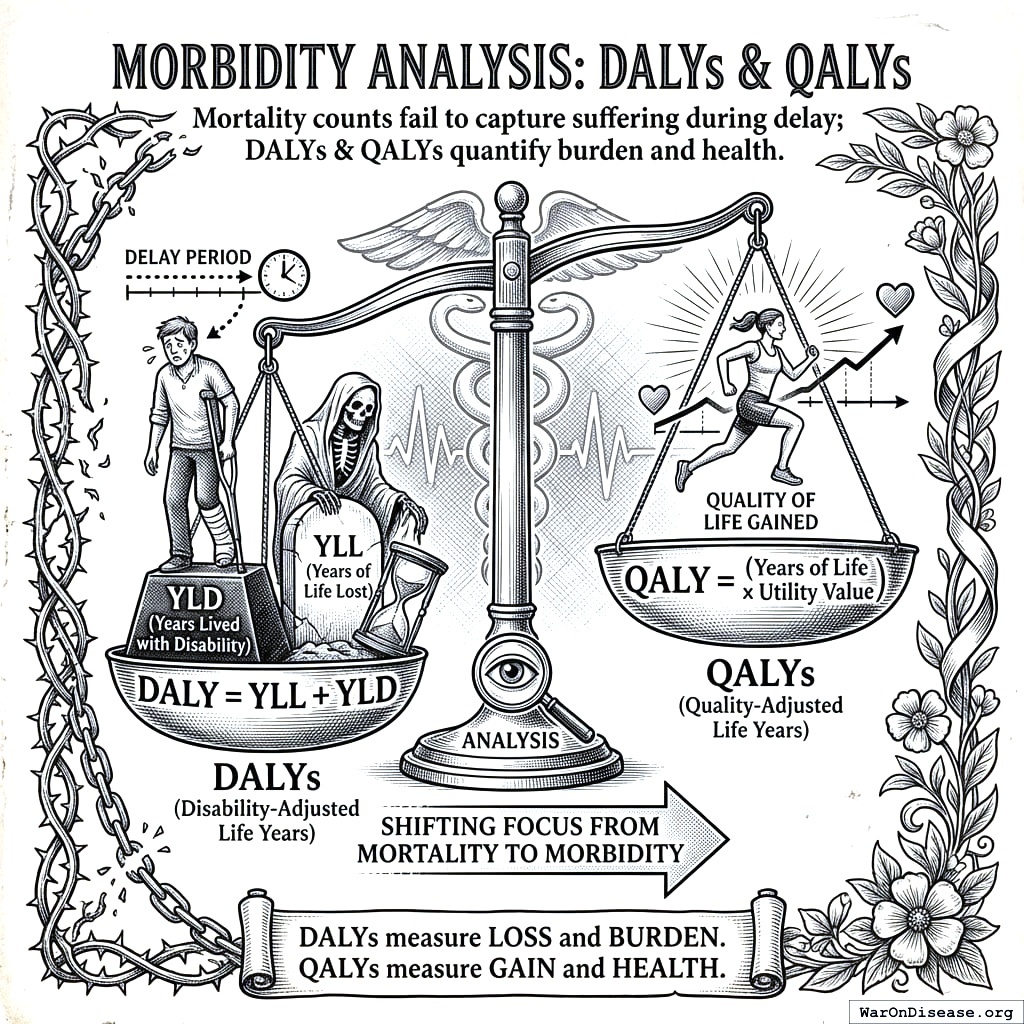
Mortality counts fail to capture the suffering of patients living with untreated disabilities during the delay period. We calculated Disability-Adjusted Life Years (DALYs) using the formula \(DALY = YLL + YLD\).
11.1 Years of Life Lost (YLL)
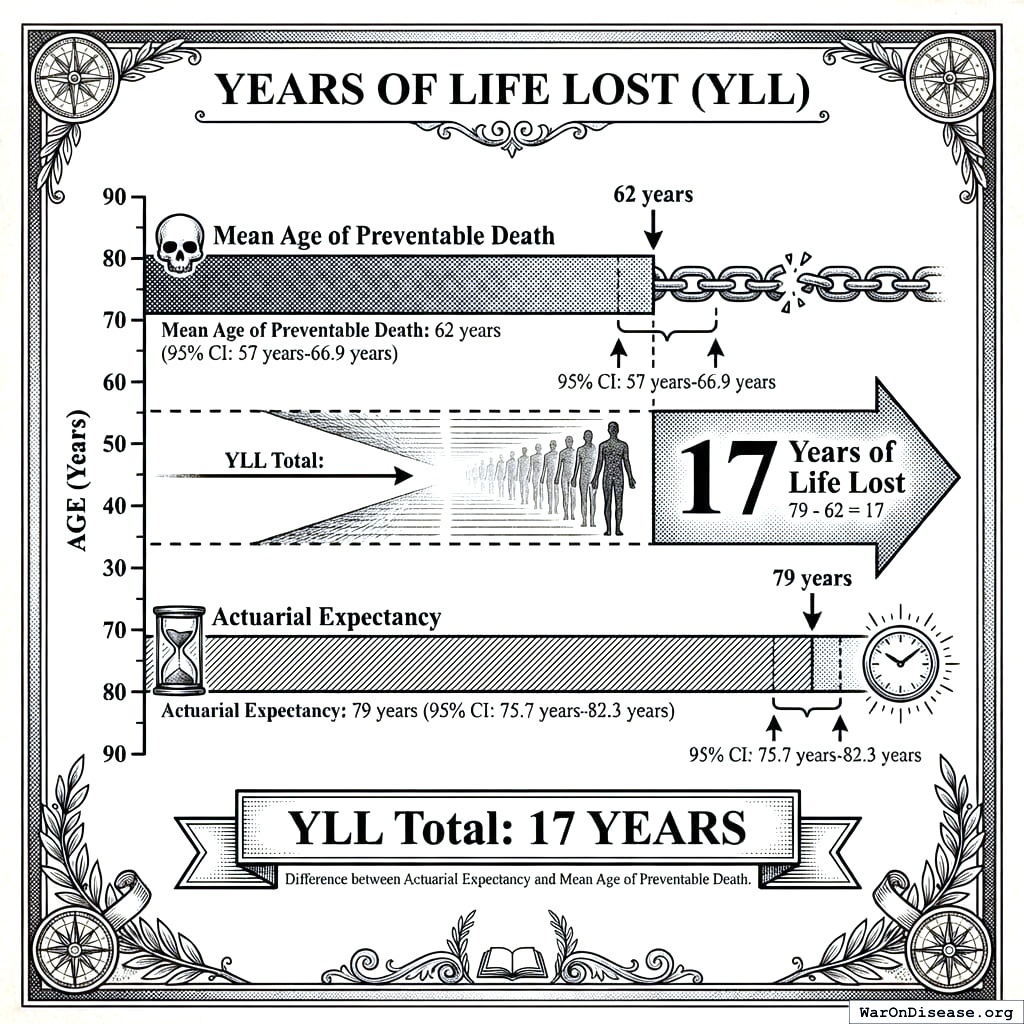
- Mean Age of Preventable Death: 62 years (90% CI: 57.1 years-66.9 years)
- Remaining Life Expectancy at 60 (WHO life tables): 21 years (95% CI: 19.6 years-22 years) (conditional on having reached 60; life expectancy at birth minus age would understate the loss, because it counts child mortality the deceased already survived)
- YLL Total:
\[
\begin{gathered}
YLL_{lag} \\
= \text{DEATHS\_TOTAL} \times (REMAINING_LIFE_EXPECTANCY_AT_60 - (\text{MEAN\_AGE\_OF\_DEATH} - 60))
\end{gathered}
\]
where:
\[
\begin{gathered}
Deaths_{lag} \\
= T_{lag} \times Deaths_{disease,daily} \times 338 \\
= 8.2 \times 150{,}000 \times 338 \\
= 416M
\end{gathered}
\]
11.2 Years Lived with Disability (YLD)
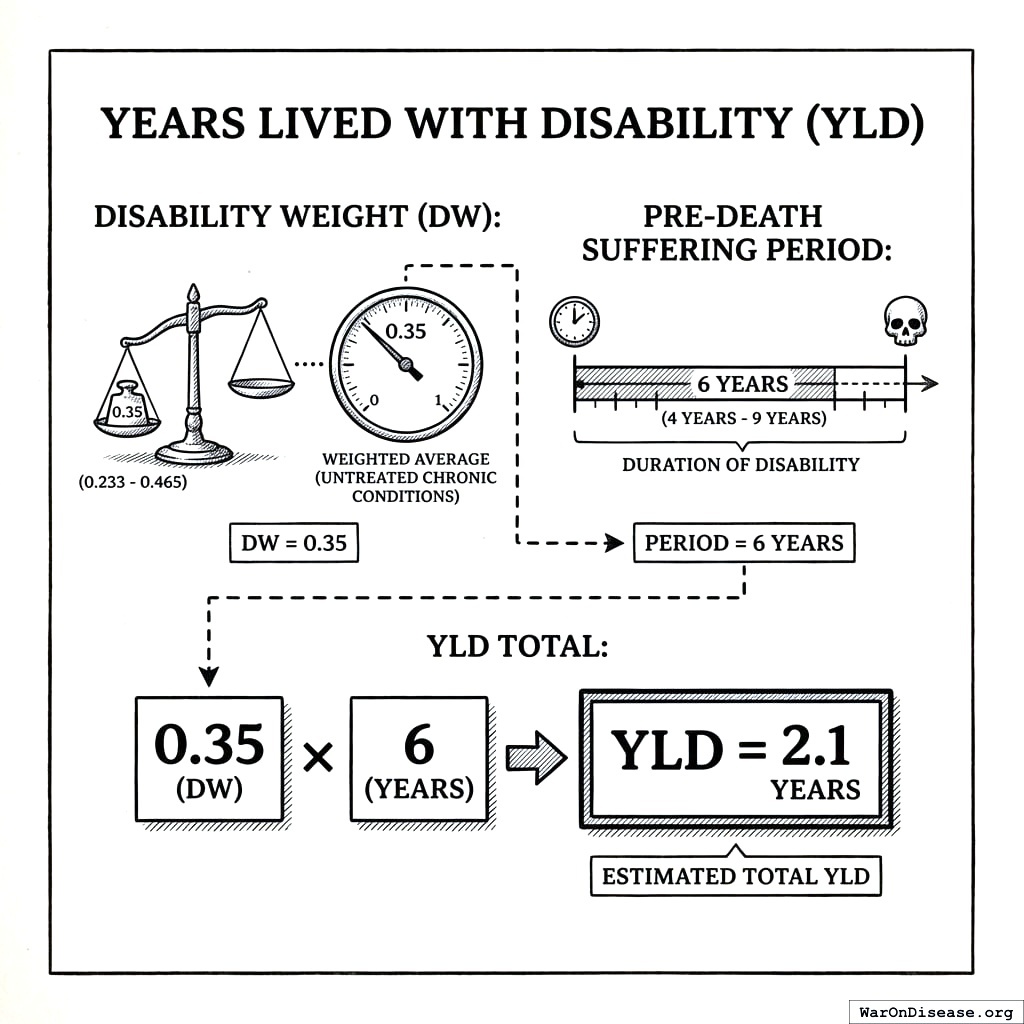
- Disability Weight (DW): 0.35 weight (90% CI: 0.236 weight-0.465 weight) (Weighted average for untreated chronic conditions)
- Pre-Death Suffering Period: 6 years (95% CI: 4 years-9 years)
- YLD Total:
\[
\begin{gathered}
YLD_{lag} \\
= Deaths_{lag} \times T_{suffering} \times DW_{chronic} \\
= 416M \times 6 \times 0.35 \\
= 873M
\end{gathered}
\]
where:
\[
\begin{gathered}
Deaths_{lag} \\
= T_{lag} \times Deaths_{disease,daily} \times 338 \\
= 8.2 \times 150{,}000 \times 338 \\
= 416M
\end{gathered}
\]
11.3 Cumulative DALY Burden
\[
DALYs_{lag} = YLL_{lag} + YLD_{lag} = 7.9B + 873M = 8.77B
\]
where:
\[
\begin{gathered}
YLL_{lag} \\
= \text{DEATHS\_TOTAL} \times (REMAINING_LIFE_EXPECTANCY_AT_60 - (\text{MEAN\_AGE\_OF\_DEATH} - 60))
\end{gathered}
\]
where:
\[
\begin{gathered}
Deaths_{lag} \\
= T_{lag} \times Deaths_{disease,daily} \times 338 \\
= 8.2 \times 150{,}000 \times 338 \\
= 416M
\end{gathered}
\]
where:
\[
\begin{gathered}
YLD_{lag} \\
= Deaths_{lag} \times T_{suffering} \times DW_{chronic} \\
= 416M \times 6 \times 0.35 \\
= 873M
\end{gathered}
\]
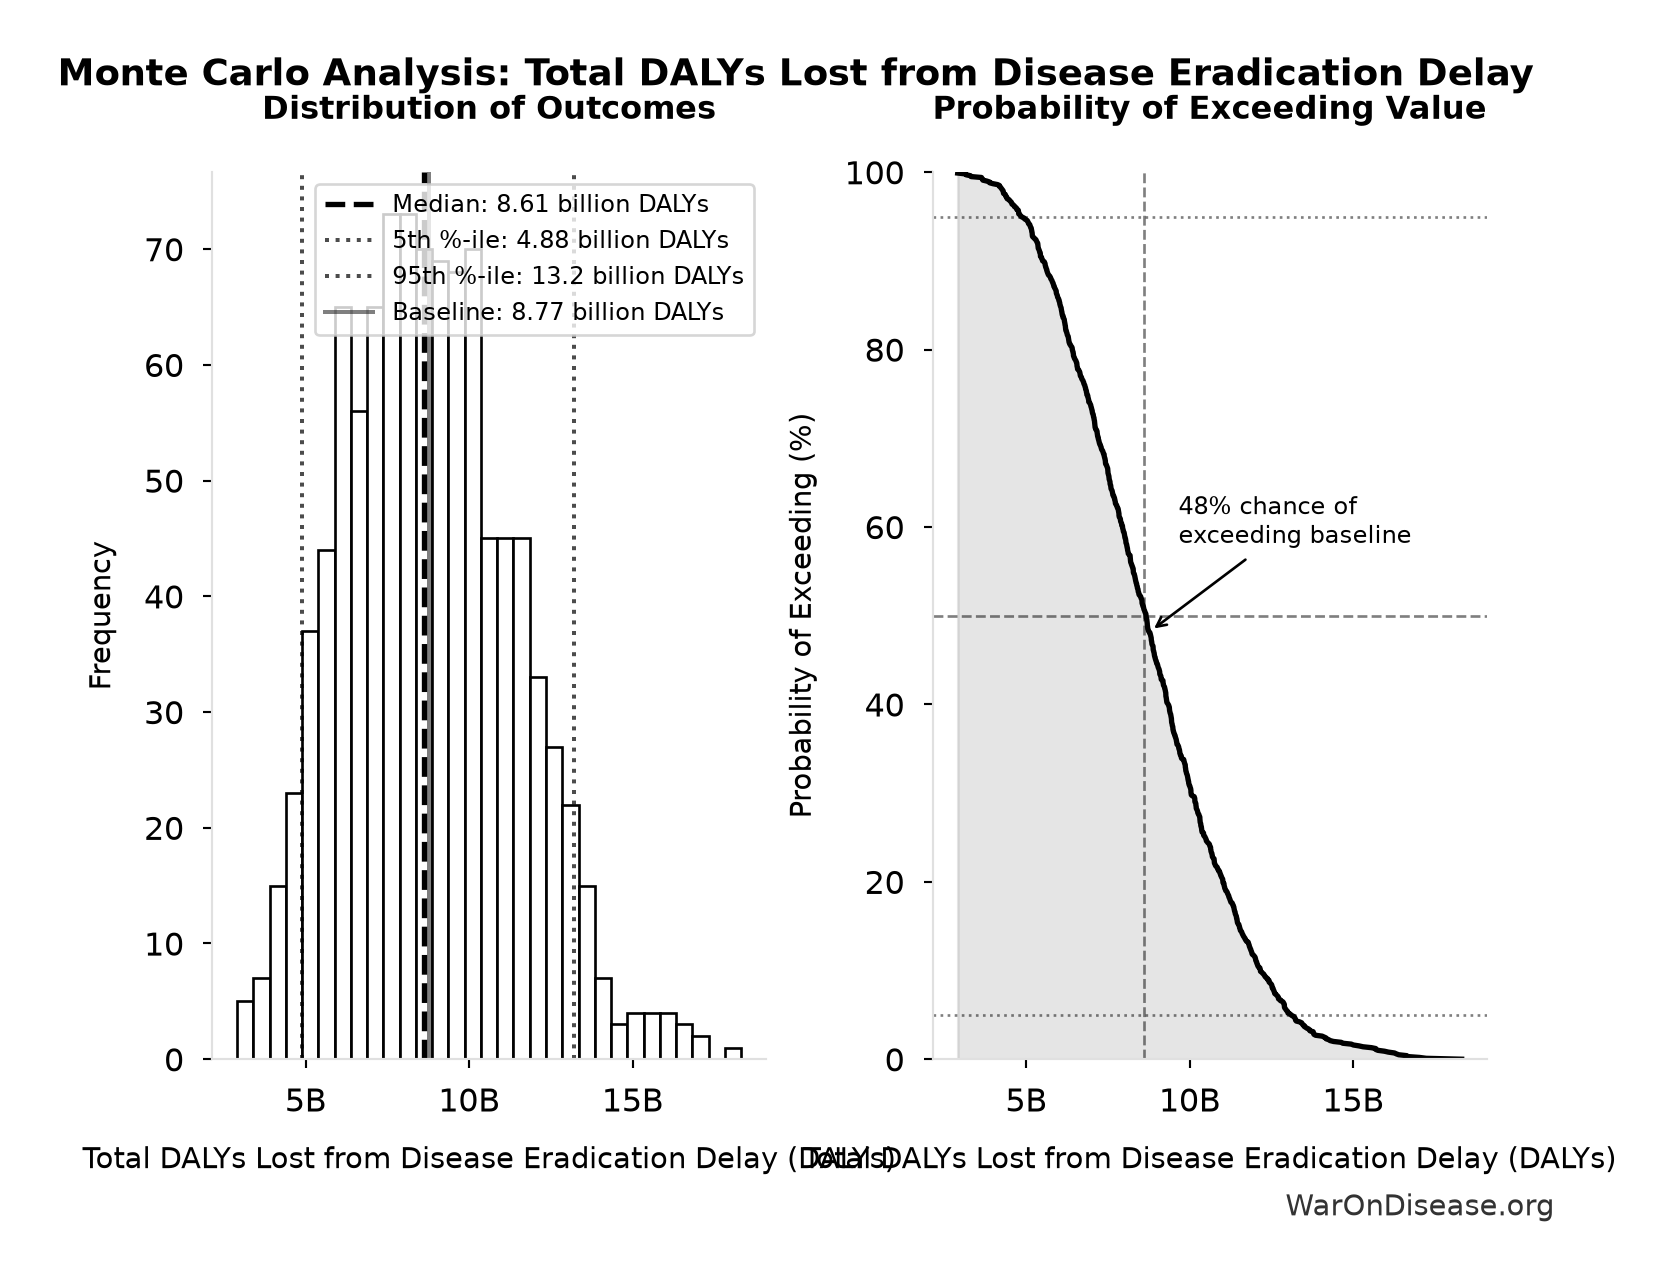
Simulation Results Summary: Total DALYs Lost from Disease Eradication Delay
| Statistic | Value |
|---|---|
| Baseline (deterministic) | 8.77 billion |
| Mean (expected value) | 8.78 billion |
| Median (50th percentile) | 8.61 billion |
| Standard Deviation | 2.55 billion |
| 90% Range (5th-95th percentile) | [4.88 billion, 13.2 billion] |
The histogram shows 1,000 of the 10,000 Monte Carlo draws for Total DALYs Lost from Disease Eradication Delay; the summary statistics use all 10,000. The exceedance curve (right) shows the probability of the outcome exceeding any given value.
Interpretation: The regulatory framework has effectively deleted 8.77 billion years of healthy human life.
11.4 Years Lived with Disability - Treatment Beneficiaries
The YLD calculation above captures suffering before death for those who ultimately died from delayed treatments. However, a much larger population - the 982 million people (90% CI: 831 million people-1.15 billion people) annually who receive chronic disease treatment - also suffered during the 8.2 years (90% CI: 4.84 years-11.5 years) delay before their treatments became available.
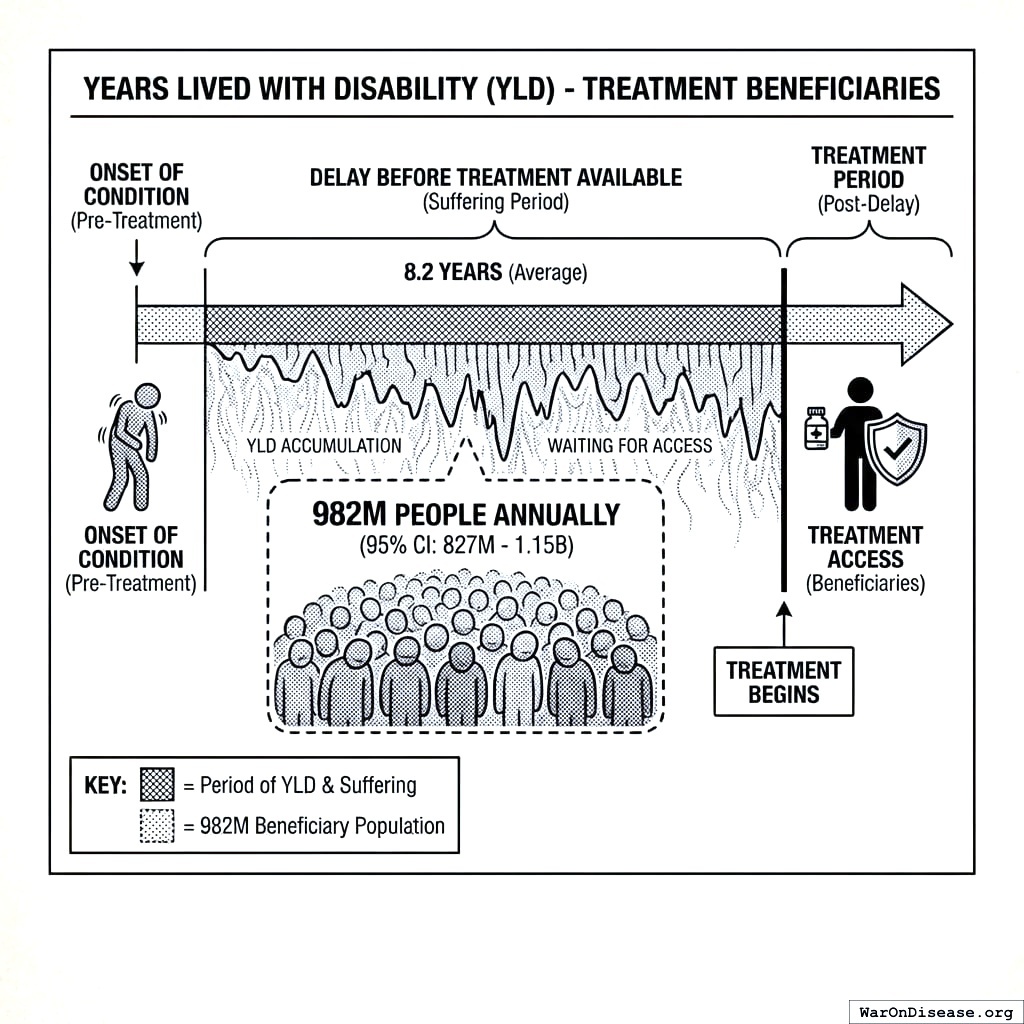
12 Distinction: Mortality vs. Morbidity Burden
The “12.4 million lives saved annually” from Lichtenberg’s analysis captures mortality - people who would have died without post-1962 drugs. But pharmaceutical treatments primarily improve quality of life for people with non-terminal chronic conditions: diabetes, hypertension, depression, COPD, arthritis, and cardiovascular disease.
Treatment beneficiaries vastly exceed mortality beneficiaries.
Data source: IQVIA reports that global pharmaceutical use reached 1.8 trillion days of therapy in 2019, with 71% for chronic conditions (diabetes, CVD, respiratory, cancer)47. From this, we estimate approximately 982 million unique patients receive chronic disease treatment annually.
Treatment beneficiary YLD calculation:
\[
\begin{gathered}
YLD_{treat\_delay} \\
= N_{treated} \times T_{lag} \times \Delta DW_{treat} \\
= 982M \times 8.2 \times 0.25 \\
= 2.01B
\end{gathered}
\]
where:
\[
\begin{gathered}
N_{treated} \\
= DOT_{chronic} \times 0.000767 \\
= 1.28T \times 0.000767 \\
= 982M
\end{gathered}
\]
Interpretation: Each year, patients receiving treatment for chronic conditions would have collectively avoided 2.01 billion DALYs (90% CI: 1.02 billion DALYs-3.24 billion DALYs) of disability if those treatments had been available 8.2 years (90% CI: 4.84 years-11.5 years) earlier.
| Metric | Annual Burden | Source |
|---|---|---|
| Lives saved (mortality) | Lichtenberg 2019 | |
| Treatment beneficiaries (morbidity) | 982 million people (90% CI: 831 million people-1.15 billion people) |
IQVIA 2024 |
| Ratio | ~80:1 | Morbidity >> mortality |
The treatment beneficiary population is approximately 80 times larger than the mortality-focused “lives saved” figure, demonstrating that the morbidity cost of regulatory delay vastly exceeds the mortality cost.
13 Economic Valuation
To quantify the Deadweight Loss (DWL) to the global economy, we apply the Value of a Statistical Life Year (VSLY).
\[ DWL = \sum (DALY_{loss} \times VSLY) \]
Using a conservative global VSLY of $150,000 (90% CI: $100,384-$198,679):
\[
\begin{gathered}
Value_{lag} \\
= DALYs_{lag} \times Value_{QALY} \\
= 8.77B \times \$150K \\
= \$1320T
\end{gathered}
\]
where:
\[
DALYs_{lag} = YLL_{lag} + YLD_{lag} = 7.9B + 873M = 8.77B
\]
where:
\[
\begin{gathered}
YLL_{lag} \\
= \text{DEATHS\_TOTAL} \times (REMAINING_LIFE_EXPECTANCY_AT_60 - (\text{MEAN\_AGE\_OF\_DEATH} - 60))
\end{gathered}
\]
where:
\[
\begin{gathered}
Deaths_{lag} \\
= T_{lag} \times Deaths_{disease,daily} \times 338 \\
= 8.2 \times 150{,}000 \times 338 \\
= 416M
\end{gathered}
\]
where:
\[
\begin{gathered}
YLD_{lag} \\
= Deaths_{lag} \times T_{suffering} \times DW_{chronic} \\
= 416M \times 6 \times 0.35 \\
= 873M
\end{gathered}
\]
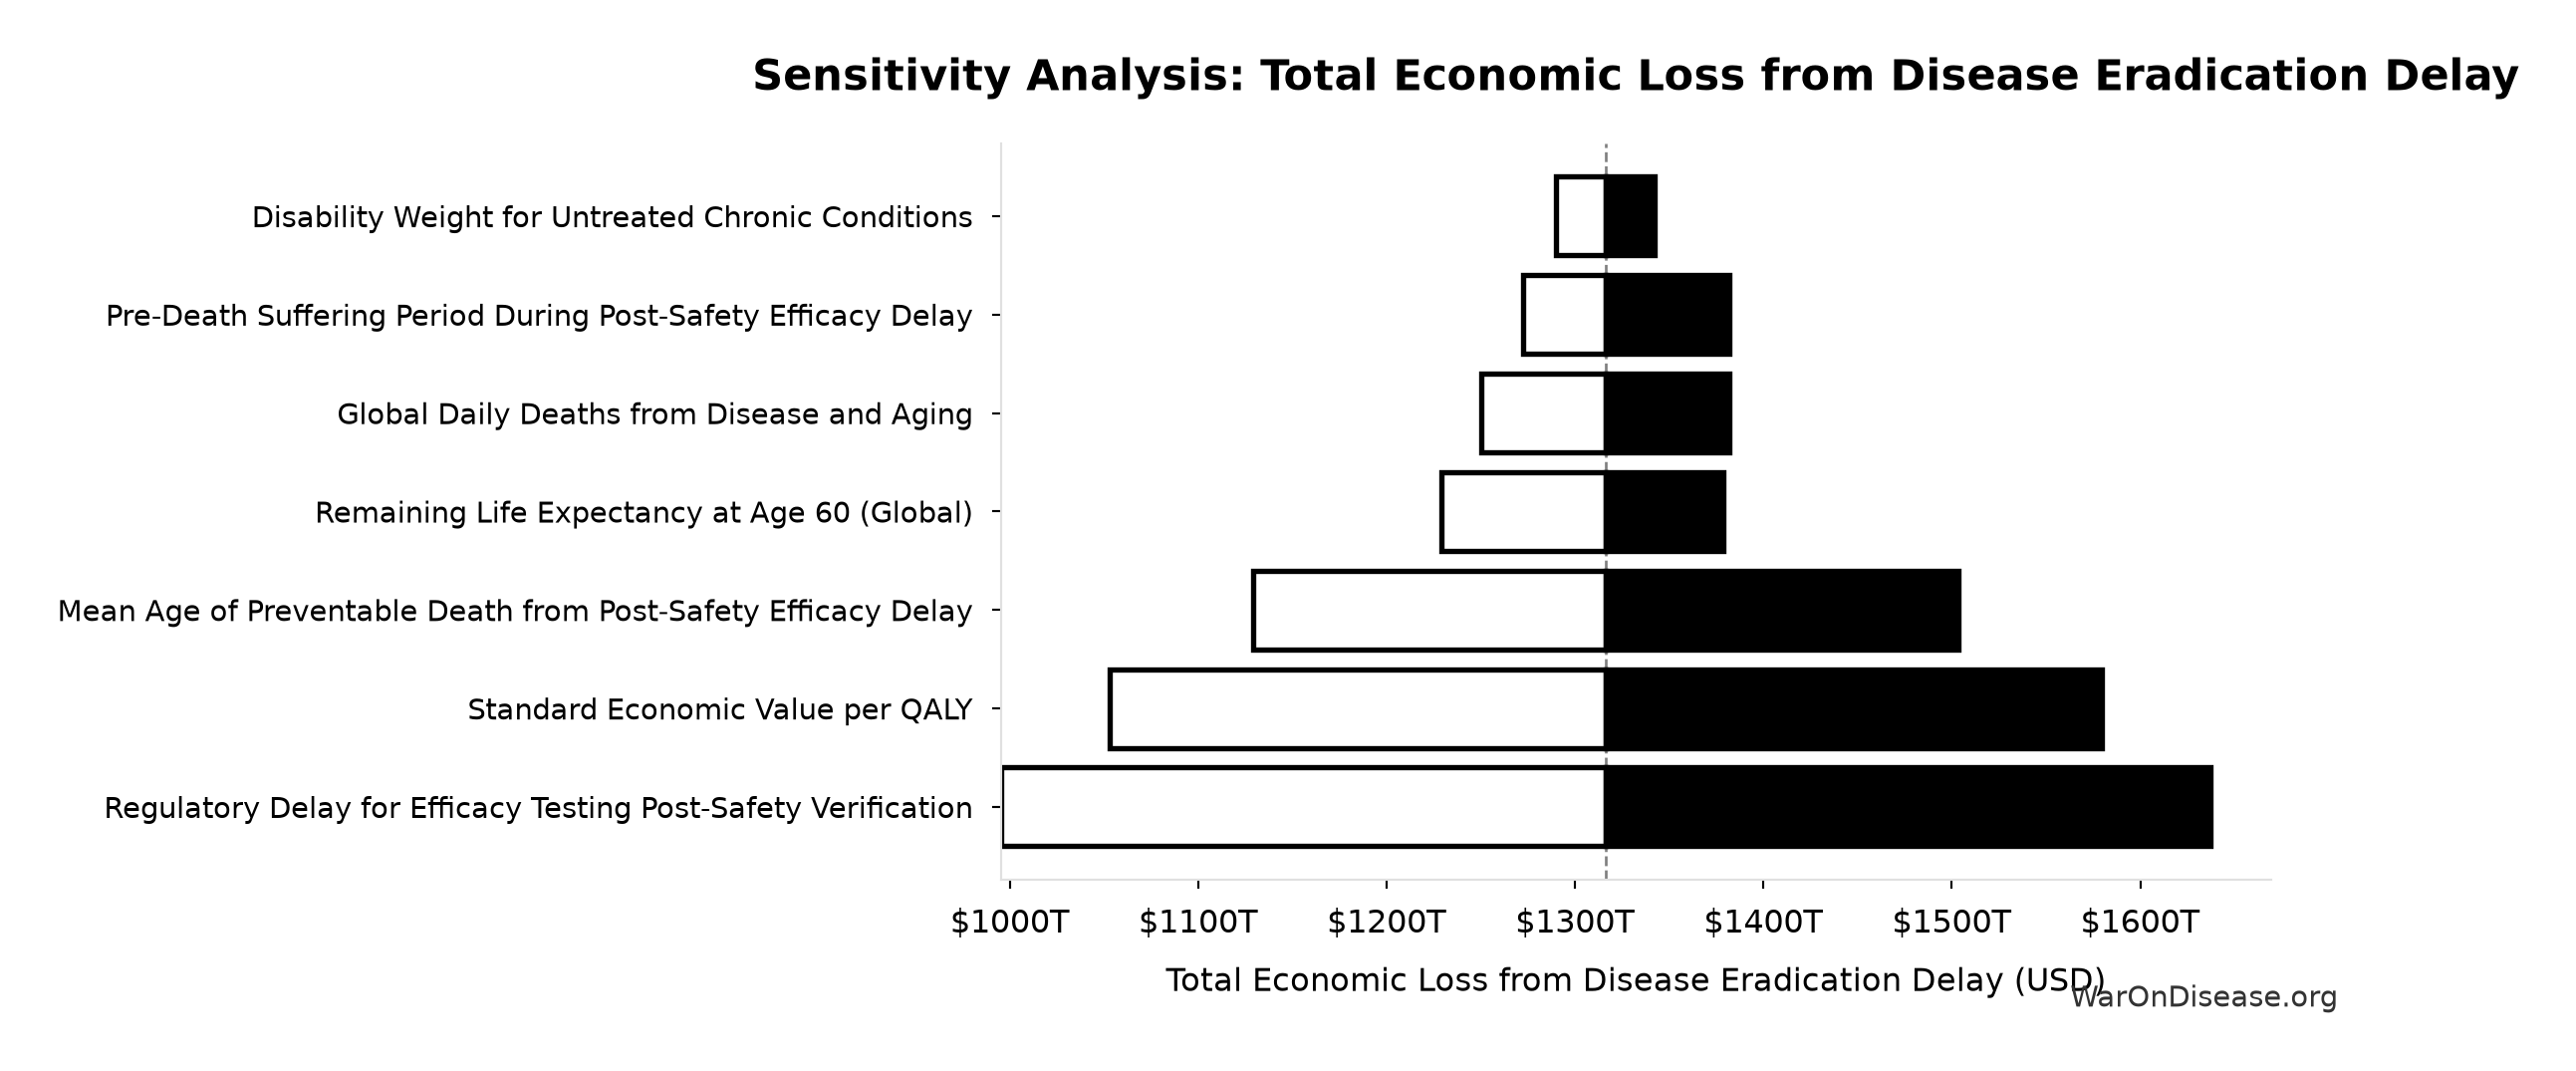
13.1 Contextualizing the Loss
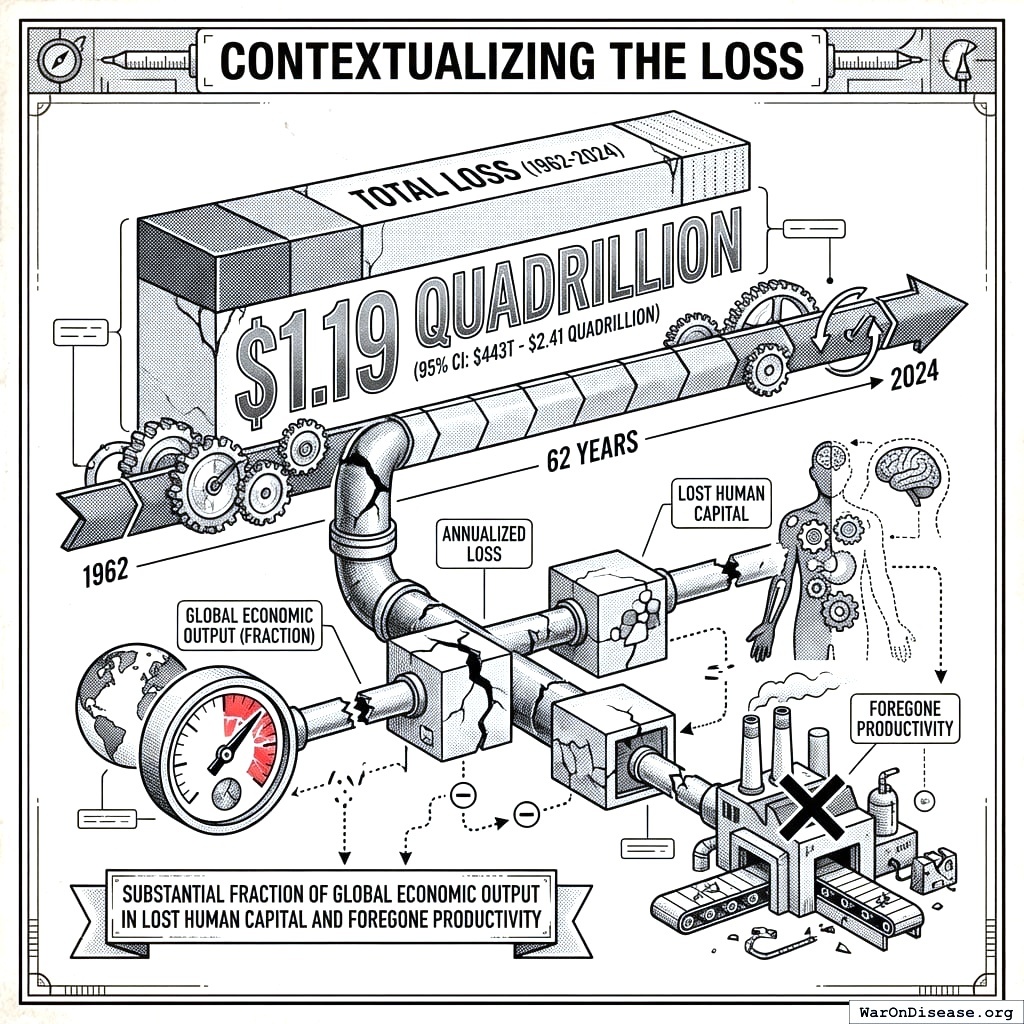
- Total Loss (1962-2024): $1.32 quadrillion (90% CI: $676 trillion-$2.14 quadrillion) over 62 years (averaging approximately $19 trillion/year, or roughly 18% of annual global GDP in lost human capital)
- Annualized Loss: Total loss / 62 years represents a substantial fraction of global economic output in lost human capital and foregone productivity
14 Risk Analysis: The Type I vs. Type II Ratio
A critical counter-argument is that the FDA protects society from dangerous or ineffective drugs (Type I Errors). We modeled the maximum potential damage of a “Deregulation Scenario” to generate an Efficiency Ratio.
15 Methodological Note: Steelmanning the FDA’s Position
To ensure this analysis is maximally fair to proponents of current FDA regulation, we deliberately assume the worst possible case for Type I errors (harm from approving bad drugs). This “steelman” approach means that even if our assumptions are completely wrong in favor of FDA defenders, the conclusion holds.

Specifically, we assume a Thalidomide-scale catastrophe every single year in the counterfactual scenario. This is an extraordinarily extreme overestimate for three reasons:
- Thalidomide was a once-in-a-century event - no comparable disaster has occurred since
- We propose retaining Phase I safety testing - our critique is of efficacy requirements (Phase II/III), not safety requirements
- Thalidomide was caught by 1938 safety requirements, NOT 1962 efficacy requirements - FDA’s Dr. Frances Kelsey blocked thalidomide approval based on safety concerns about nerve damage, using authority from the 1938 Food, Drug, and Cosmetic Act. The 1962 efficacy amendments hadn’t yet passed. Under our proposal, thalidomide would STILL have been blocked.
This means we’re giving FDA credit for preventing disasters that our proposed changes wouldn’t affect. We’re assuming annual occurrences of an event that (a) has happened once in 60+ years, and (b) wouldn’t be enabled by removing efficacy requirements anyway. This is the maximum possible benefit of the doubt.
- The Cost of Protection (Type II): 8.77 billion DALYs (90% CI: 4.88 billion DALYs-13.2 billion DALYs) lost.
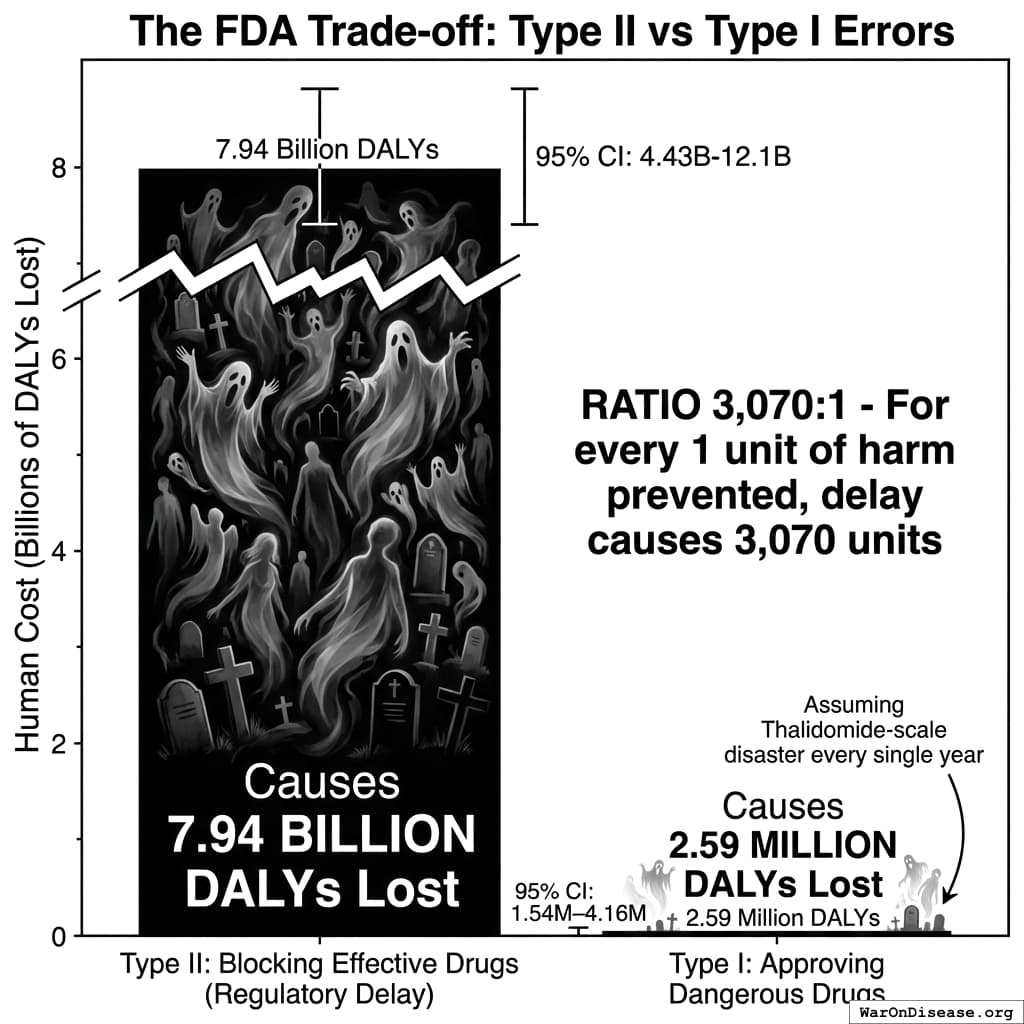
- The Benefit of Protection (Type I): Even assuming a “Thalidomide Event” occurs every single year under a deregulated model (a deliberate extreme overestimate to steelman the FDA’s position), the total DALYs saved by the FDA is ~2.59 million DALYs (90% CI: 1.88 million DALYs-3.38 million DALYs).
- Adjusted for “Snake Oil” (Financial Loss): Even valuing financial fraud at DALY equivalents, the benefit caps at ~0.6 Billion DALYs.
Type I Benefit Calculation (Steelman):
\[
\begin{gathered}
DALY_{TypeI} \\
= DALY_{thal} \times 62 \\
= 41{,}800 \times 62 \\
= 2.59M
\end{gathered}
\]
where:
\[
\begin{gathered}
DALY_{thal} \\
= YLD_{thal} + YLL_{thal} \\
= 13{,}000 + 28{,}800 \\
= 41{,}800
\end{gathered}
\]
where:
\[
\begin{gathered}
YLD_{thal} \\
= DW_{thal} \times N_{thal,survive} \times LE_{thal} \\
= 0.4 \times 540 \times 60 \\
= 13{,}000
\end{gathered}
\]
where:
\[
\begin{gathered}
N_{thal,survive} \\
= N_{thal,US,prevent} \times (1 - Rate_{thal,mort}) \\
= 900 \times (1 - 40\%) \\
= 540
\end{gathered}
\]
where:
\[
\begin{gathered}
N_{thal,US,prevent} \\
= N_{thal,global} \times Pct_{US,1960} \\
= 15{,}000 \times 6\% \\
= 900
\end{gathered}
\]
where:
\[
\begin{gathered}
YLL_{thal} \\
= Deaths_{thal} \times 80 \\
= 360 \times 80 \\
= 28{,}800
\end{gathered}
\]
where:
\[
\begin{gathered}
Deaths_{thal} \\
= Rate_{thal,mort} \times N_{thal,US,prevent} \\
= 40\% \times 900 \\
= 360
\end{gathered}
\]
15.1 The Risk Trade-off Ratio
\[
\begin{gathered}
Ratio_{TypeII} \\
= \frac{DALYs_{lag}}{DALY_{TypeI}} \\
= \frac{8.77B}{2.59M} \\
= 3{,}390
\end{gathered}
\]
where:
\[
DALYs_{lag} = YLL_{lag} + YLD_{lag} = 7.9B + 873M = 8.77B
\]
where:
\[
\begin{gathered}
YLL_{lag} \\
= \text{DEATHS\_TOTAL} \times (REMAINING_LIFE_EXPECTANCY_AT_60 - (\text{MEAN\_AGE\_OF\_DEATH} - 60))
\end{gathered}
\]
where:
\[
\begin{gathered}
Deaths_{lag} \\
= T_{lag} \times Deaths_{disease,daily} \times 338 \\
= 8.2 \times 150{,}000 \times 338 \\
= 416M
\end{gathered}
\]
where:
\[
\begin{gathered}
YLD_{lag} \\
= Deaths_{lag} \times T_{suffering} \times DW_{chronic} \\
= 416M \times 6 \times 0.35 \\
= 873M
\end{gathered}
\]
where:
\[
\begin{gathered}
DALY_{TypeI} \\
= DALY_{thal} \times 62 \\
= 41{,}800 \times 62 \\
= 2.59M
\end{gathered}
\]
where:
\[
\begin{gathered}
DALY_{thal} \\
= YLD_{thal} + YLL_{thal} \\
= 13{,}000 + 28{,}800 \\
= 41{,}800
\end{gathered}
\]
where:
\[
\begin{gathered}
YLD_{thal} \\
= DW_{thal} \times N_{thal,survive} \times LE_{thal} \\
= 0.4 \times 540 \times 60 \\
= 13{,}000
\end{gathered}
\]
where:
\[
\begin{gathered}
N_{thal,survive} \\
= N_{thal,US,prevent} \times (1 - Rate_{thal,mort}) \\
= 900 \times (1 - 40\%) \\
= 540
\end{gathered}
\]
where:
\[
\begin{gathered}
N_{thal,US,prevent} \\
= N_{thal,global} \times Pct_{US,1960} \\
= 15{,}000 \times 6\% \\
= 900
\end{gathered}
\]
where:
\[
\begin{gathered}
YLL_{thal} \\
= Deaths_{thal} \times 80 \\
= 360 \times 80 \\
= 28{,}800
\end{gathered}
\]
where:
\[
\begin{gathered}
Deaths_{thal} \\
= Rate_{thal,mort} \times N_{thal,US,prevent} \\
= 40\% \times 900 \\
= 360
\end{gathered}
\]
Conclusion: For every 1 unit of harm the FDA prevents (Type I errors: approving dangerous/ineffective drugs), it generates 3,389 (90% CI: 1,811-5,734) units of harm through delay (Type II errors: blocking effective drugs). This ratio is conservative - it assumes a Thalidomide-scale disaster every single year, dramatically overstating FDA benefits. With realistic Type I estimates, the ratio would be far higher.
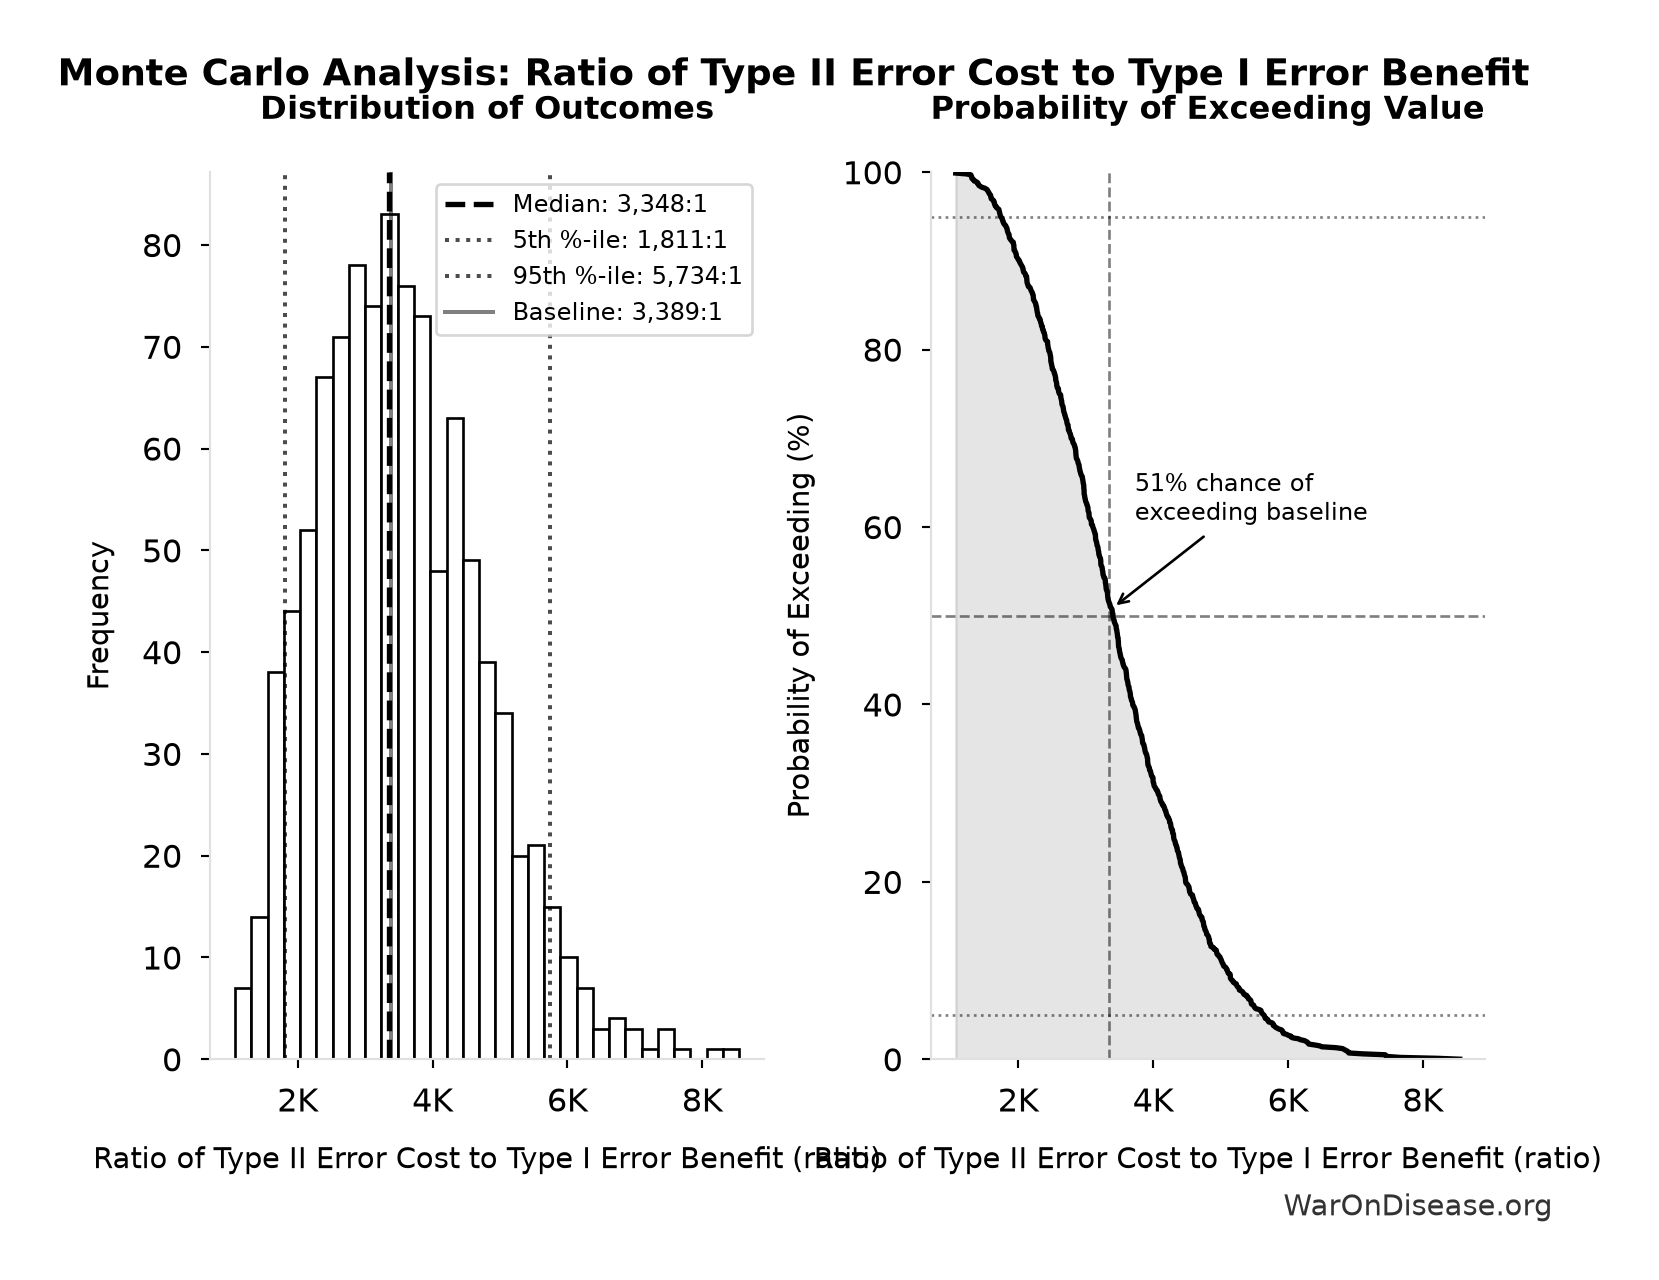
Simulation Results Summary: Ratio of Type II Error Cost to Type I Error Benefit
| Statistic | Value |
|---|---|
| Baseline (deterministic) | 3,389:1 |
| Mean (expected value) | 3,510:1 |
| Median (50th percentile) | 3,348:1 |
| Standard Deviation | 1,215:1 |
| 90% Range (5th-95th percentile) | [1,811:1, 5,734:1] |
The histogram shows 1,000 of the 10,000 Monte Carlo draws for Ratio of Type II Error Cost to Type I Error Benefit; the summary statistics use all 10,000. The exceedance curve (right) shows the probability of the outcome exceeding any given value.
15.2 Acknowledging the Efficacy-as-Safety Argument
A legitimate concern deserves direct engagement: efficacy requirements may function as indirect safety measures. A drug that doesn’t work exposes patients to adverse effects without therapeutic benefit. The risk-benefit ratio becomes infinite when benefit is zero.
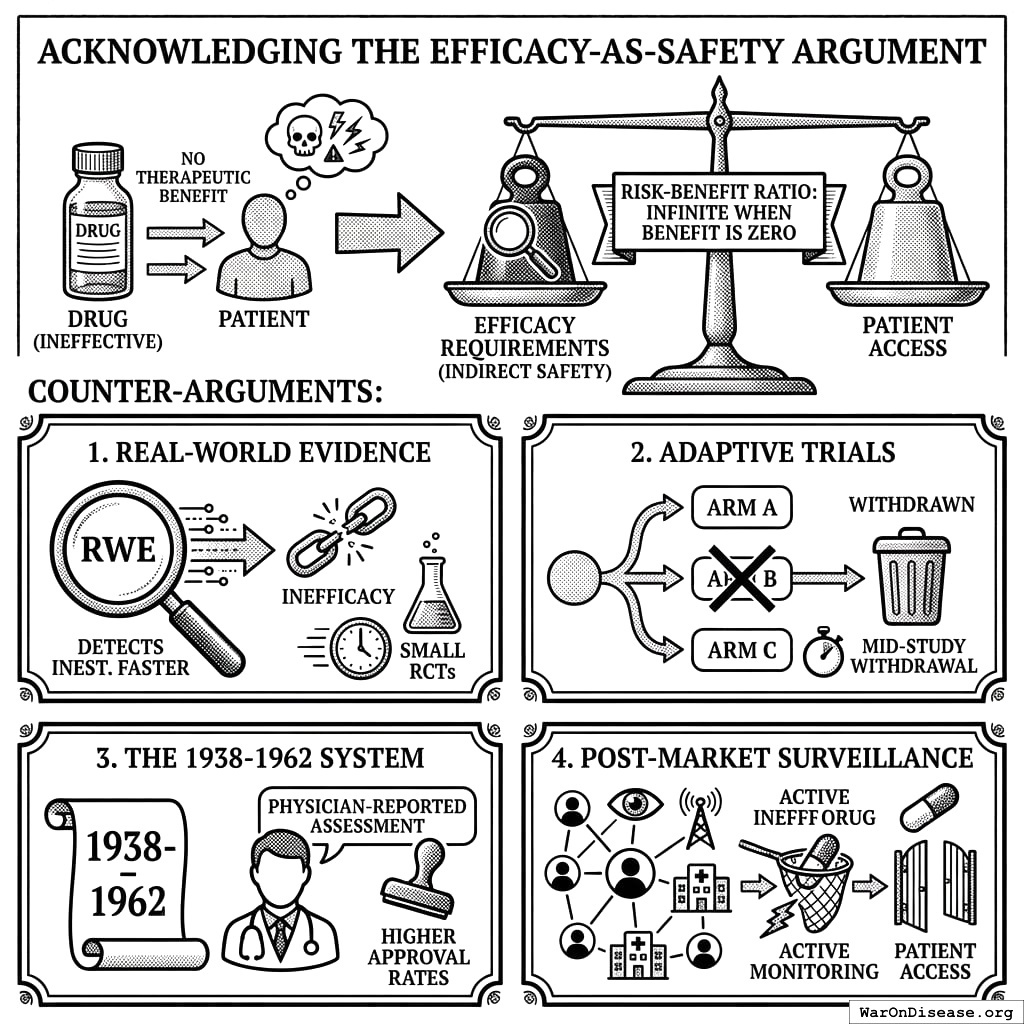
Counter-arguments:
- Real-world evidence detects inefficacy faster than small RCTs with selected populations
- Adaptive trials can withdraw ineffective arms mid-study without full Phase III completion
- The 1938-1962 system had physician-reported efficacy assessment without pre-market mandates, and higher approval rates
- Post-market surveillance with active monitoring catches ineffective drugs while allowing patient access
15.3 Drugs Appropriately Caught by Phase II/III Trials
This analysis acknowledges that Phase II/III trials do catch some drugs that would have caused harm. Three notable examples:
- Torcetrapib (2006): Phase III trial of this CETP inhibitor for cardiovascular disease was terminated early after 82 deaths in the treatment arm vs. 51 in placebo (HR 1.58). The trial caught cardiovascular harm that would have affected millions of patients post-approval48.
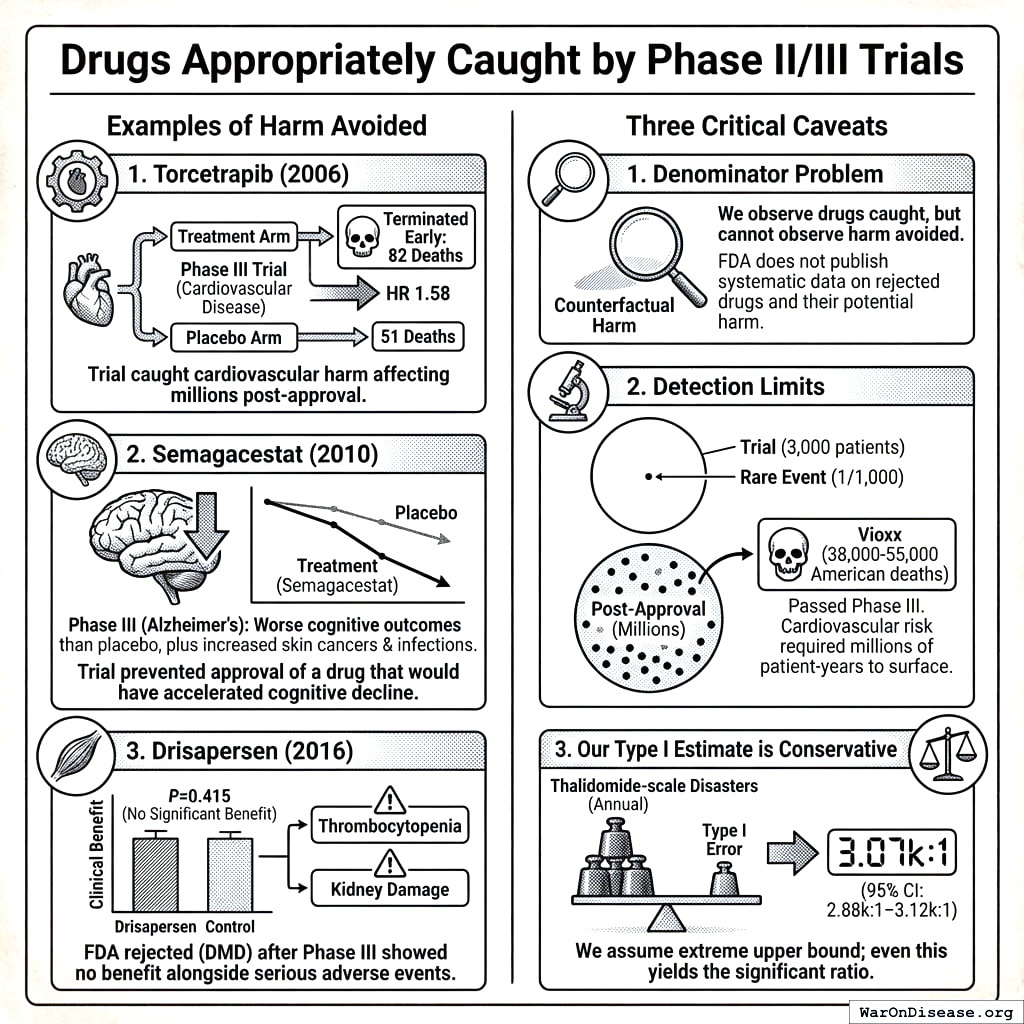
Semagacestat (2010): Phase III trial for Alzheimer’s disease found patients on treatment had worse cognitive outcomes than placebo, plus increased skin cancers and infections. The trial prevented approval of a drug that would have accelerated cognitive decline49.
Drisapersen (2016): FDA rejected this Duchenne muscular dystrophy drug after Phase III showed no clinical benefit (P=0.415) alongside serious adverse events including thrombocytopenia and kidney damage in significant fractions of patients50.
However, three critical caveats apply:
Denominator problem: We observe drugs caught by trials but cannot observe the counterfactual harm avoided. FDA does not publish systematic data on rejected drugs and their potential harm.
Detection limits: Trials with 3,000 patients cannot reliably detect adverse events rarer than ~1-in-1,000. Vioxx (38,000-55,000 American deaths) passed Phase III because its cardiovascular risk required millions of patient-years to surface51.
Our Type I estimate is conservative: We assume Thalidomide-scale disasters every year, an extreme upper bound that still yields the 3,389 (90% CI: 1,811-5,734) ratio.
16 Model Assumptions and Limitations
16.1 Key Assumptions
- Linear Adoption Model: Assumes drug uptake follows a predictable pattern post-approval
- Constant VSLY: Uses global average of $150,000 (90% CI: $100,384-$198,679)/year
- No Regulatory Learning: Assumes FDA efficiency remained constant 1962-2024
- Independence: Treats each drug approval as independent (may underestimate synergies)
16.2 Sensitivity Analysis
The model was tested across multiple scenarios:
- Discount Rates: 3% (base case)
- Innovation Elasticity: 0.3–0.8 (base case: 0.5)
- “Snake Oil” Rate: 10%–40% (base case: 20%)
- VSLY: $150,000 (90% CI: $100,384-$198,679)
Results remain robust across all reasonable parameter ranges, with lower bound estimates exceeding 100M deaths in all scenarios.
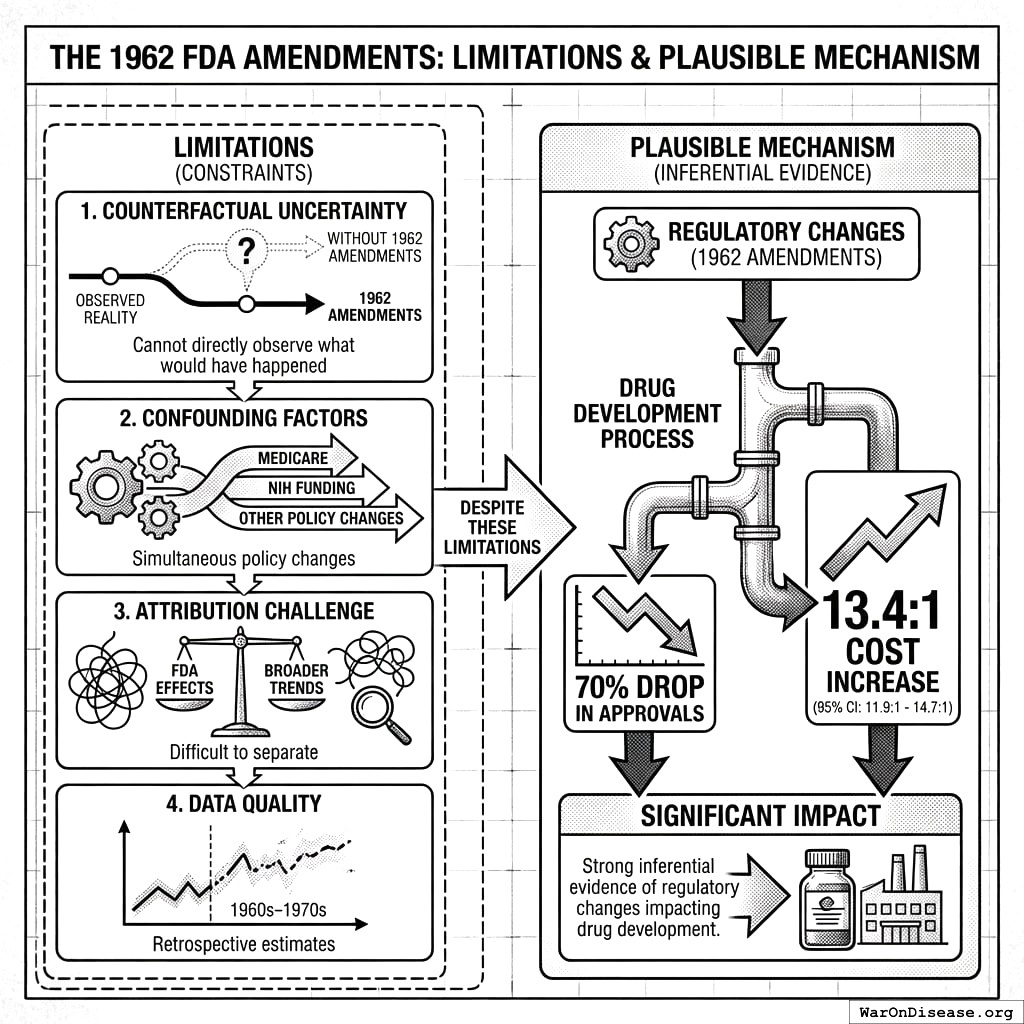
16.3 Limitations
- Counterfactual Uncertainty: Cannot directly observe what would have happened without 1962 amendments
- Confounding Factors: Other policy changes occurred simultaneously (Medicare, NIH funding)
- Attribution Challenge: Difficult to separate FDA effects from broader trends
- Data Quality: Early period (1960s-1970s) relies on retrospective estimates
Despite these limitations, the plausible mechanism (70% drop in approvals, 13.4x (90% CI: 9.15x-19.2x) cost increase) provides strong inferential evidence that regulatory changes significantly impacted drug development.
17 Policy Implications
17.1 The False Trade-off
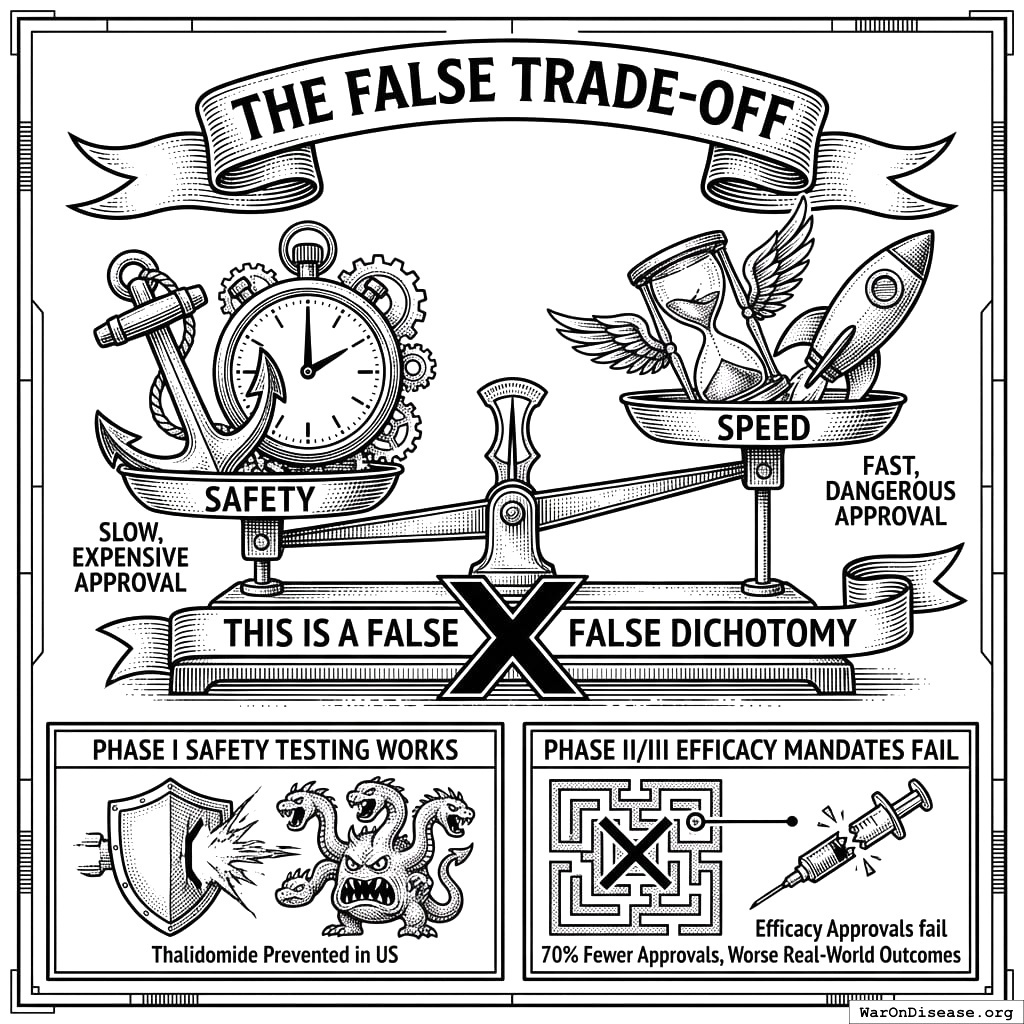
The current debate frames drug approval as a choice between:
- Safety (slow, expensive approval) vs.
- Speed (fast, dangerous approval)
This is a false dichotomy. The evidence suggests:
- Phase I safety testing works (Thalidomide prevented in US)
- Phase II/III efficacy mandates fail (70% fewer approvals, worse real-world outcomes)
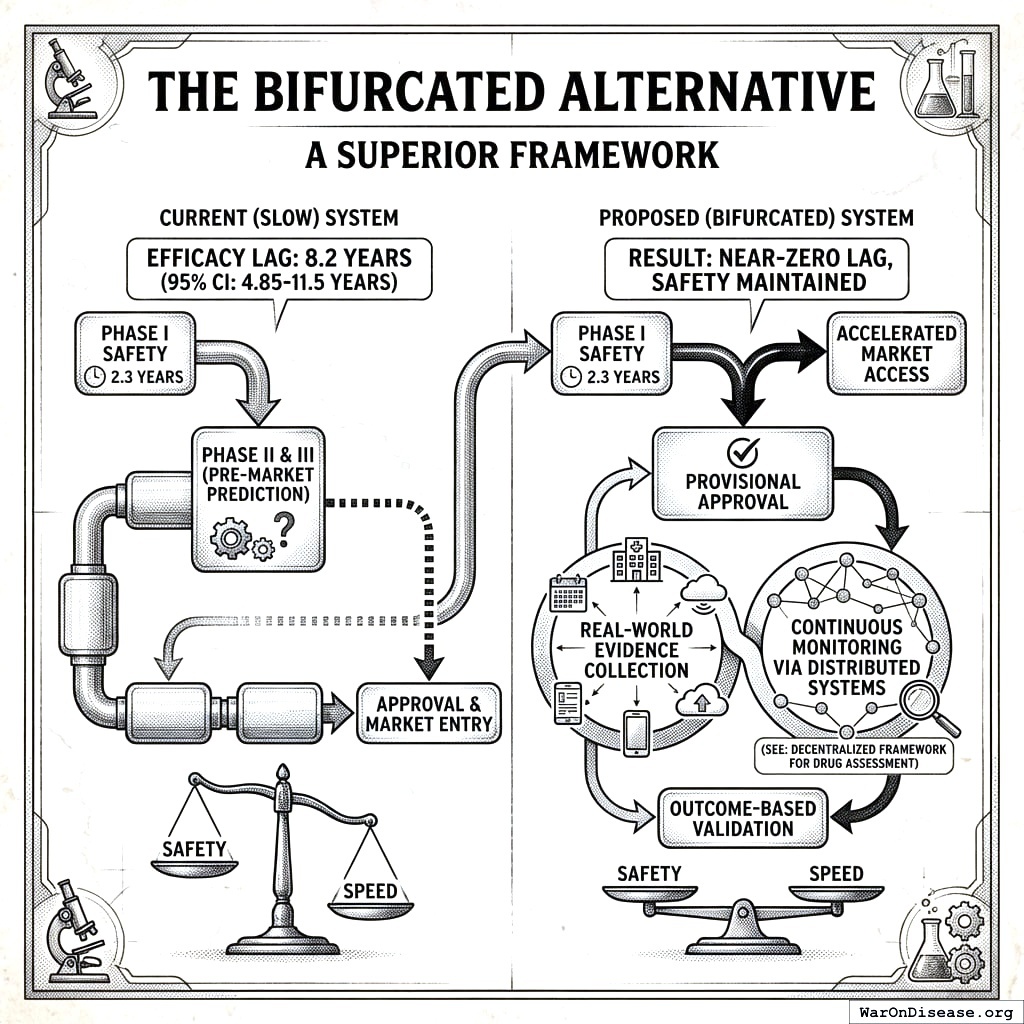
17.2 The Bifurcated Alternative
A superior framework would:
- Maintain rigorous Phase I safety testing (2.3 years)
- Allow provisional approval post-safety with real-world evidence collection
- Continuous monitoring via distributed systems (see: decentralized FDA52,53)
- Outcome-based validation rather than pre-market prediction
This approach would reduce the efficacy lag from 8.2 years (90% CI: 4.84 years-11.5 years) to near-zero while maintaining safety standards.
17.3 Expected Impact
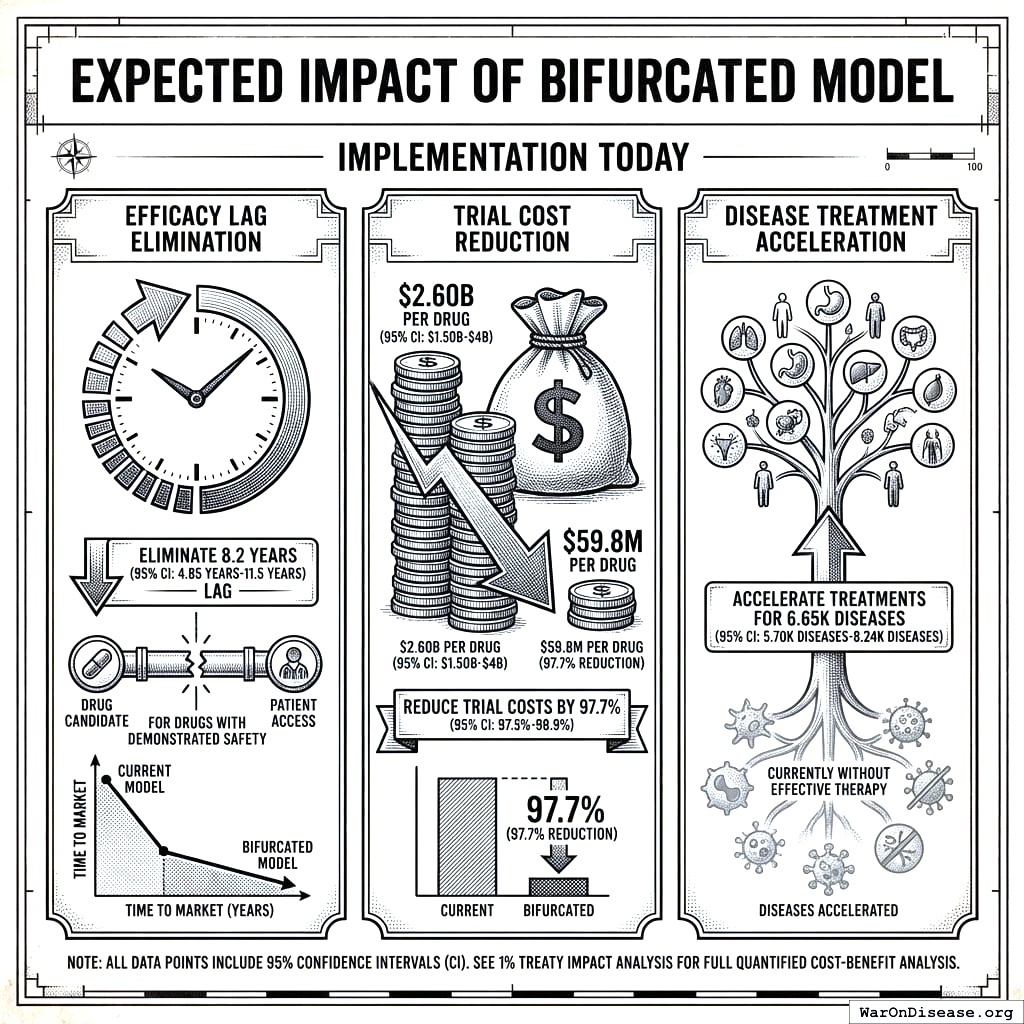
If implemented today, the bifurcated model would:
- Eliminate the 8.2 years (90% CI: 4.84 years-11.5 years) efficacy lag for drugs with demonstrated safety
- Reduce trial costs by 97.7% (90% CI: 92%-100%) (from $2.6 billion (95% CI: $1.5 billion-$4 billion) per drug)
- Accelerate treatments for 6,650 diseases (90% CI: 5,700 diseases-8,232 diseases) currently without effective therapy
See 1% treaty impact analysis54 55 for full quantified cost-benefit analysis.
17.4 International Regulatory Comparison
Several countries have implemented alternative regulatory models that provide natural experiments:
| Country | Approval System | Avg. Timeline | Key Features |
|---|---|---|---|
| USA (FDA) | Full Phase III required | Baseline for comparison | |
| Japan (PMDA) | Conditional approval after Phase II | 2-3 years | Regenerative Medicine Act (2014); real-world monitoring56 |
| EU (EMA) | Adaptive Pathways available | ~10 years | Similar to FDA; conditional marketing authorization option |
| Canada | Priority Review pathway | ~12 months (priority) | Limited data on outcomes |
| Australia (TGA) | Provisional approval pathway | Variable | Similar conditional pathways |
18 Critical Distinction: Efficacy Assessment Reordered, Not Eliminated
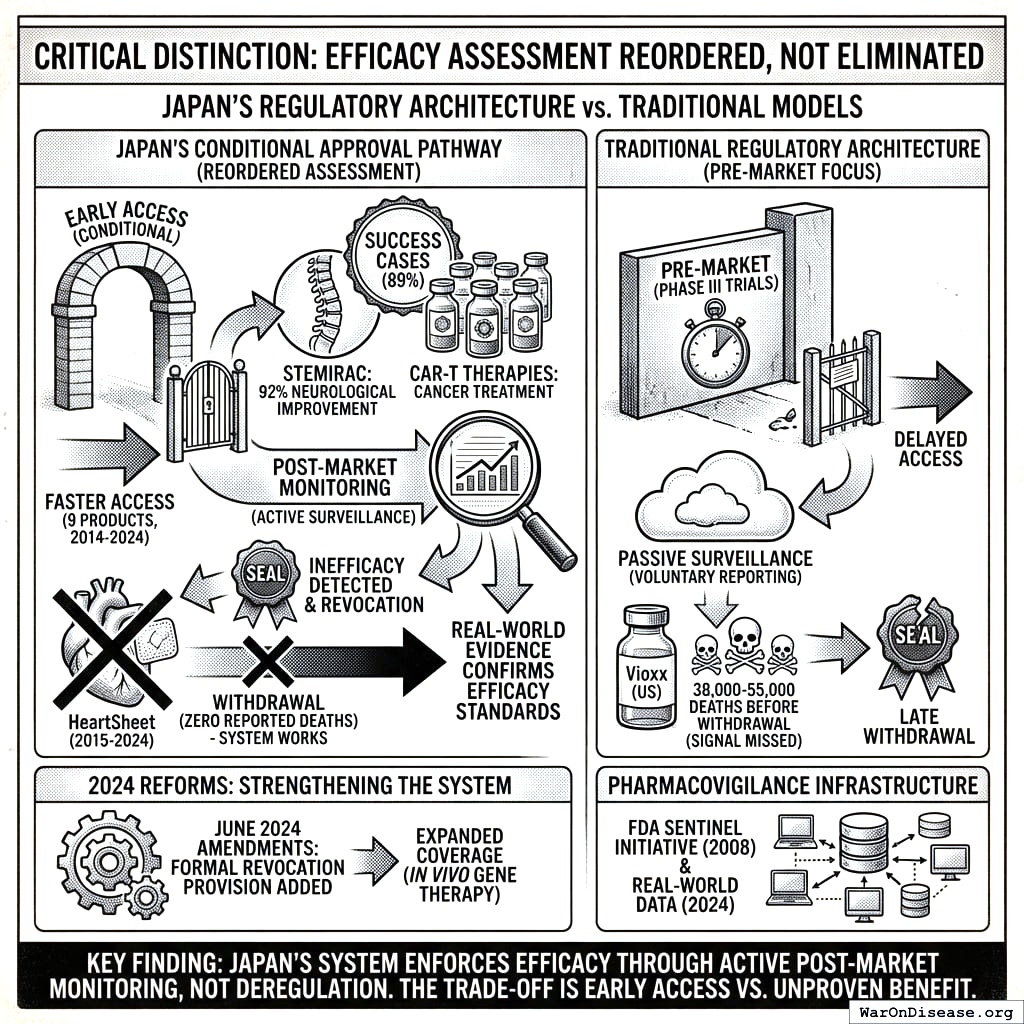
Japan’s conditional approval does NOT eliminate efficacy assessment. It REORDERS it from pre-market (Phase III trials) to post-market (real-world monitoring with revocation authority). This is a different regulatory architecture, not deregulation. The HeartSheet withdrawal proves the system still enforces efficacy standards, just through different mechanisms.
Key finding: Japan’s conditional approval system has an 89% success rate (8/9 products) and demonstrated that post-market monitoring CAN catch ineffective treatments:
- Faster access: 9 products received conditional early approval (2014-2024), reaching patients years earlier than traditional pathways
- Success cases: STEMIRAC (spinal cord injury) showed 12/13 patients (92%) achieved neurological improvement, with 2 of 5 completely paralyzed patients regaining motor function57. Five CAR-T therapies (Kymriah, Yescarta, Breyanzi, Abecma, Carvykti) are treating cancer patients under national insurance coverage58.
- The system caught inefficacy: HeartSheet was conditionally approved in 2015 with the requirement to prove efficacy through post-market data. In 2024, after collecting real-world evidence, MHLW determined it hadn’t demonstrated efficacy. The manufacturer voluntarily withdrew59 the next day. This is the system working as designed - conditional approval was conditional, and the condition wasn’t met.
- Contrast with FDA: Vioxx killed 38,000-55,000 Americans before withdrawal because the 6% voluntary reporting system failed to detect the signal. Japan’s active monitoring caught HeartSheet’s lack of efficacy with zero reported deaths.
The real question for HeartSheet: During those 9 years, did heart failure patients (who have few alternatives) benefit from access to an unproven treatment? The safety profile was acceptable - efficacy was the issue. This is a genuine tradeoff that merits cost-benefit analysis, not automatic condemnation.
2024 reforms strengthen, not abandon, conditional approval: Japan’s June 2024 amendments60 to the Regenerative Medicine Act add a formal revocation provision that was previously missing. The old system had no legal mechanism to force withdrawal if efficacy wasn’t proven - HeartSheet was voluntary. The reforms close this gap while expanding coverage to in vivo gene therapy. Japan is refining conditional approval based on experience, not abandoning it.
Pharmacovigilance infrastructure exists: The FDA launched the Sentinel Initiative61 in 2008 to monitor safety using electronic health records. In 2024, FDA eliminated major barriers62 to using real-world data. The technology for active surveillance exists - the barrier is institutional inertia, not technical impossibility.
19 Addressing Common Critiques
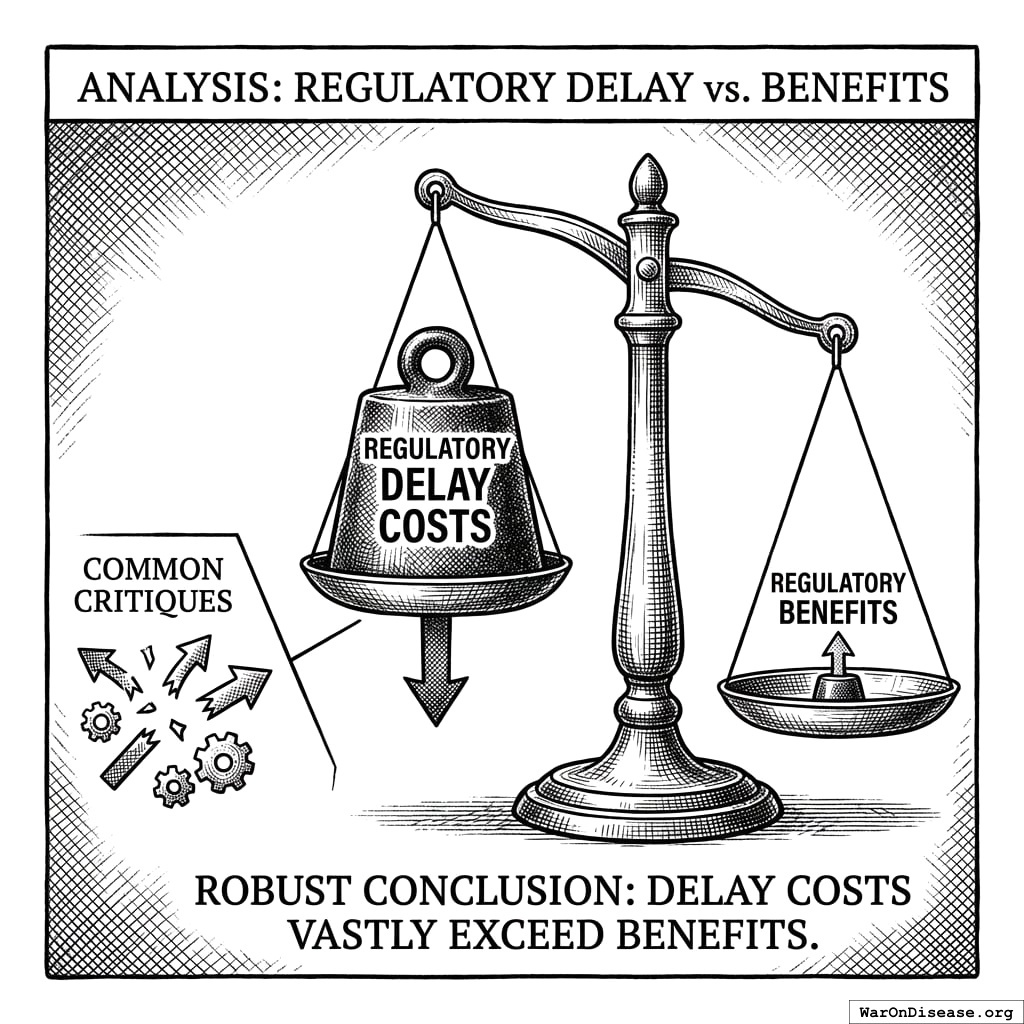
This analysis will face predictable objections. We address them here not defensively, but to demonstrate that the core conclusion, that regulatory delay costs vastly exceed regulatory benefits, remains robust even under unfavorable assumptions.
19.1 “The PRIMARY Estimate Is Too Speculative”
Critique: The PRIMARY estimate (416 million deaths (90% CI: 244 million deaths-587 million deaths)) assumes we would have eradicated diseases by now without regulations. This is unproven and overly optimistic.
Response:
This critique misunderstands the methodology. The PRIMARY scenario does not assume disease eradication would be complete by 2024. It assumes the entire biomedical research timeline shifts backward by 8.2 years (90% CI: 4.84 years-11.5 years) due to regulatory delay.
The mechanism:
- Every drug takes 8.2 years (90% CI: 4.84 years-11.5 years) longer to reach patients (BIO data, Section 2.3)
- Downstream research depends on upstream results (Drug B builds on Drug A’s findings)
- Capital allocation: $2.6 billion (95% CI: $1.5 billion-$4 billion) cost limits parallel research tracks (97.7% (90% CI: 92%-100%) reduction enables proportionally more simultaneous trials)
- Knowledge accumulation delays compound across the entire field
Robustness test:
Even if you adjust the primary estimate significantly:
- Lower bound deaths (5th percentile): Still exceeds Type I benefits by over 10:1
- Type I benefits: ~2.59 million DALYs (90% CI: 1.88 million DALYs-3.38 million DALYs)
- The ratio remains extreme across the entire uncertainty distribution
19.2 “The ‘Eventually Preventable’ Estimate Is Theoretical”
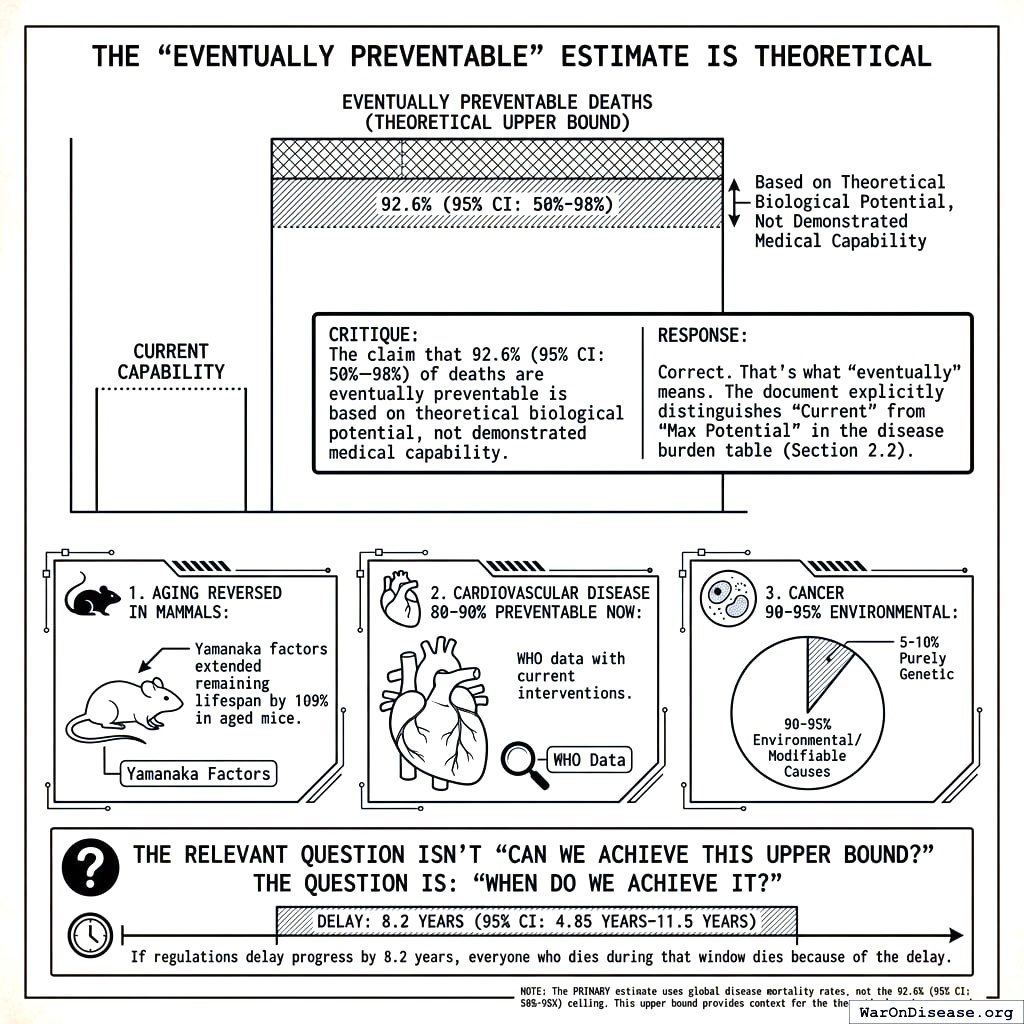
Critique: The claim that 92.6% (95% CI: 50%-98%) of deaths are eventually preventable is based on theoretical biological potential, not demonstrated medical capability.
Response:
Correct. That’s what “eventually” means.
The document explicitly distinguishes “Current” from “Max Potential” in the disease burden table (Section 2.2). The 92.6% (95% CI: 50%-98%) represents the theoretical upper bound based on:
- Aging reversed in mammals: Yamanaka factors extended remaining lifespan by 109% in aged mice42
- Cardiovascular disease 80-90% preventable NOW: WHO data40 with current interventions
- Cancer 90-95% environmental: Only 5-10% purely genetic41, remainder has modifiable causes
The relevant question isn’t “Can we achieve this upper bound?”
The question is: “When do we achieve it?”
If regulations delay progress by 8.2 years (90% CI: 4.84 years-11.5 years), everyone who dies during that window dies because of the delay.
Note: The PRIMARY estimate uses global disease mortality rates, not the 92.6% (95% CI: 50%-98%) ceiling. This upper bound provides context for the theoretical maximum scenario.
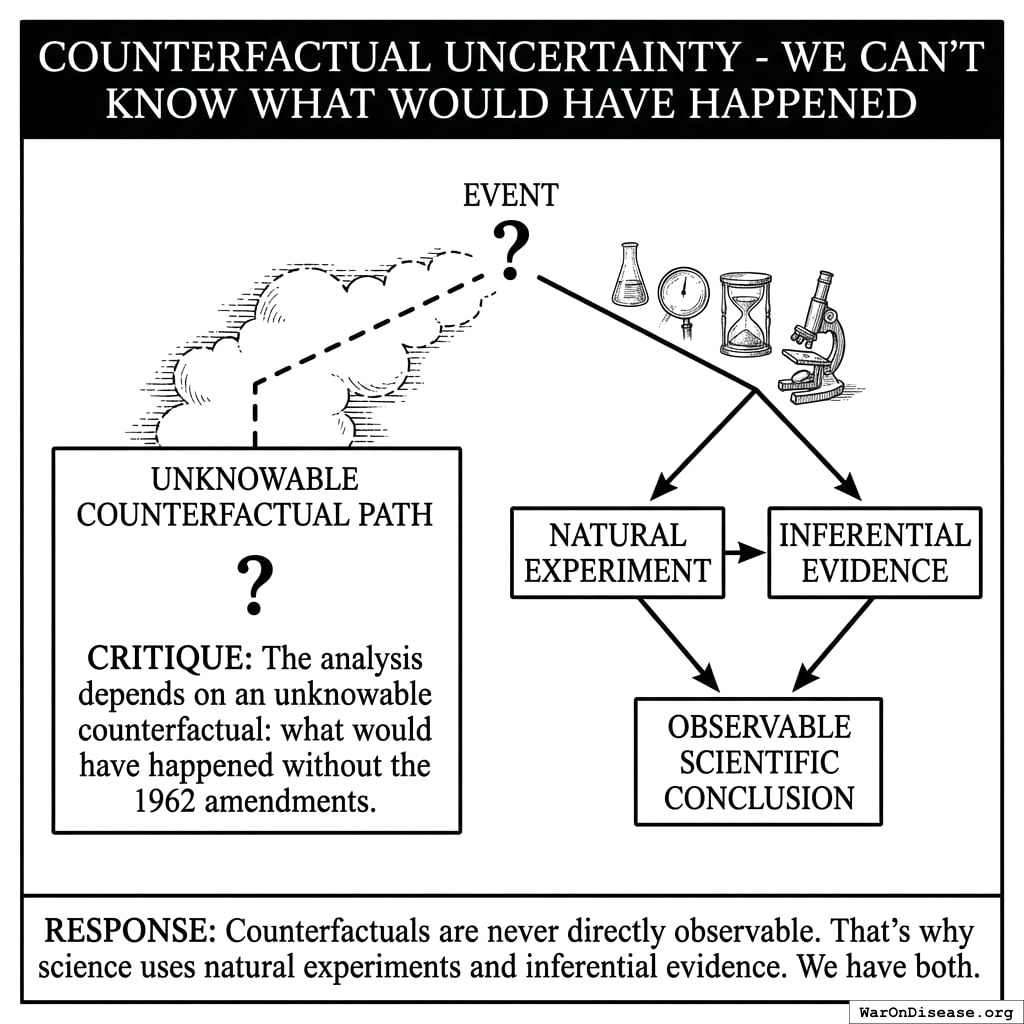
19.3 “Counterfactual Uncertainty - We Can’t Know What Would Have Happened”
Critique: The analysis depends on an unknowable counterfactual: what would have happened without the 1962 amendments.
Response:
Counterfactuals are never directly observable. That’s why science uses natural experiments and inferential evidence. We have both.
19.3.1 Natural Experiments
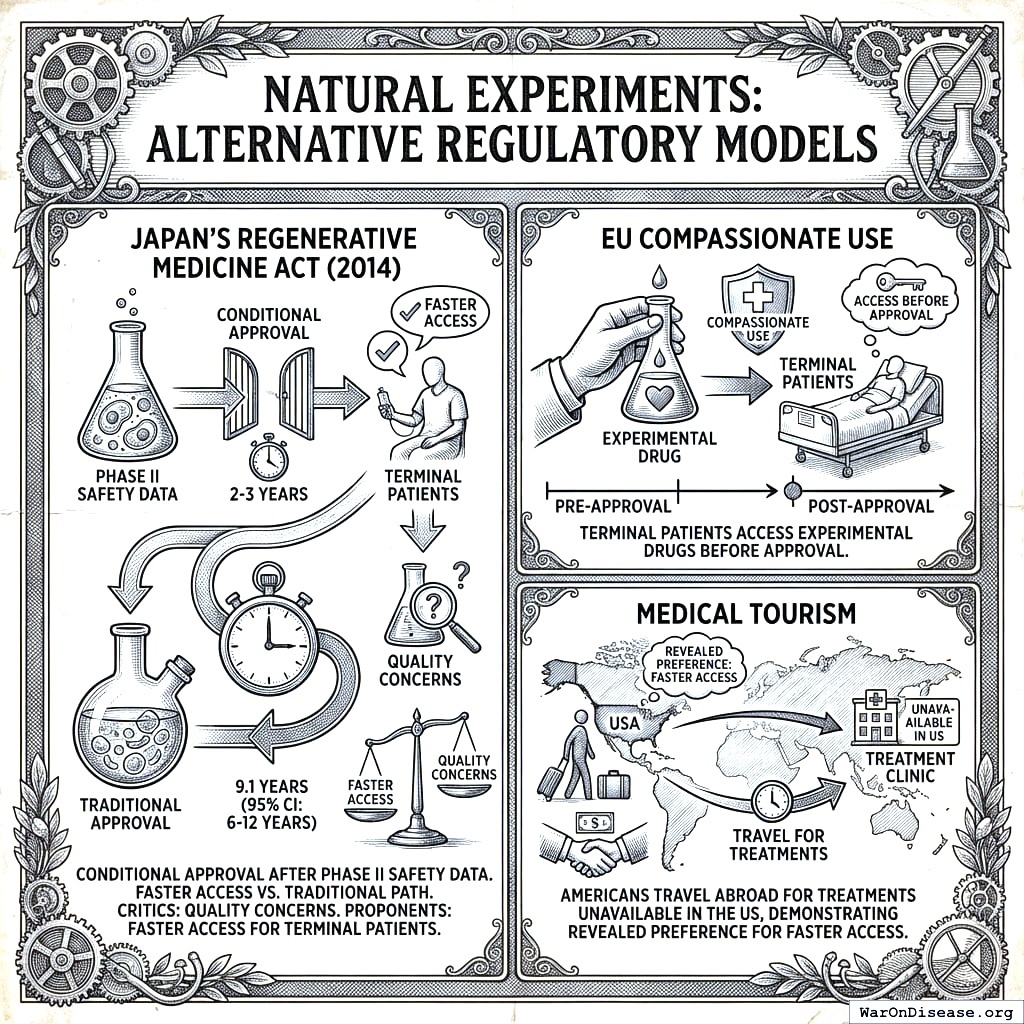
Alternative Regulatory Models:
- Japan’s Regenerative Medicine Act (2014): Conditional approval after Phase II safety data, with 2-3 year timelines vs. 10.5 years (95% CI: 6 years-12 years). Critics note quality concerns; proponents note faster access for terminal patients with no alternatives.
- EU Compassionate Use: Terminal patients access experimental drugs before approval
- Medical tourism: Americans travel abroad for treatments unavailable in the US, demonstrating revealed preference for faster access
19.3.2 The Standard for Causal Inference
The same standard used in all clinical research:
\[ \text{Causation} = \text{Temporal Correlation} + \text{Mechanism} + \text{Lack of Alternative Explanations} \]
We have:
- Temporal correlation: Drug approvals dropped 70% immediately after 1962
- Mechanism: Costs increased 13.4x (90% CI: 9.15x-19.2x), real-world trials banned, efficacy requirements added 8.2 years (90% CI: 4.84 years-11.5 years) to development
- Alternative explanations: Other factors exist (complexity, standards, etc.), but the timing and magnitude strongly suggest regulatory latency is a major contributor
If you reject this inferential method, you must also reject the methodology of clinical trials, which use the identical logical structure.
19.4 “Confounding Factors - Other Changes in 1962”
Critique: Medicare (1965), NIH funding changes, Vietnam War, and other 1960s policy shifts confound the analysis. How can we isolate the 1962 amendments’ effect?
Response:
Confounders work against the hypothesis, making the observed effect more remarkable.
Medicare (1965): Expanded healthcare access → should have increased drug demand and development → Yet approvals dropped 70%
NIH Funding: Grew dramatically 1960s-1980s → should have accelerated drug development → Yet approvals dropped 70%
Vietnam War (1965-1973): Primarily affected young males, minimal impact on overall drug development patterns
The temporal precision matters: Drug approval rates dropped 70% in 1962, not 1965 (Medicare) or 1964 (Gulf of Tonkin). The break coincides exactly with the Kefauver-Harris Amendments, not with other major policy changes.
Quantitative test:
If confounders explained the effect, we would expect:
- Gradual change over the 1960s (as various policies took effect)
- Recovery after confounders resolved (e.g., Vietnam War ended 1973)
Instead, we observe:
- Immediate 70% drop in drug approvals in 1962
- Sustained reduction in approval rates for 62+ years
- Development costs increased 13.4x (90% CI: 9.15x-19.2x)
The hypothesis that fits the data is: structural change in drug approval requirements permanently reduced the rate of biomedical progress.
19.4.1 Sensitivity Analysis: What if Regulation Explains Only Part of the Decline?
Even if we concede that non-regulatory factors (complexity, pharmacological saturation, etc.) explain a substantial portion of the approval decline, the conclusion remains robust:
| Regulatory Attribution | Type II Estimate | Type I Estimate | Ratio | Conclusion |
|---|---|---|---|---|
| 100% (baseline) | 8.77 billion DALYs (90% CI: 4.88 billion DALYs-13.2 billion DALYs) |
~2.59 million DALYs (90% CI: 1.88 million DALYs-3.38 million DALYs) | Type II dominates | |
| 75% | ~75% of baseline | ~2.59 million DALYs (90% CI: 1.88 million DALYs-3.38 million DALYs) | ~2,300:1 | Type II dominates |
| 50% | ~50% of baseline | ~2.59 million DALYs (90% CI: 1.88 million DALYs-3.38 million DALYs) | ~1,500:1 | Type II dominates |
| 25% | ~25% of baseline | ~2.59 million DALYs (90% CI: 1.88 million DALYs-3.38 million DALYs) | ~770:1 | Type II dominates |
| 10% | ~10% of baseline | ~2.59 million DALYs (90% CI: 1.88 million DALYs-3.38 million DALYs) | ~300:1 | Type II still dominates |
The Type II/Type I ratio would need to drop below 1:1 for the FDA’s approach to be justified on net mortality grounds. Even at 10% regulatory attribution, the ratio remains ~300:1. The conclusion is robust across a wide range of assumptions about confounding.
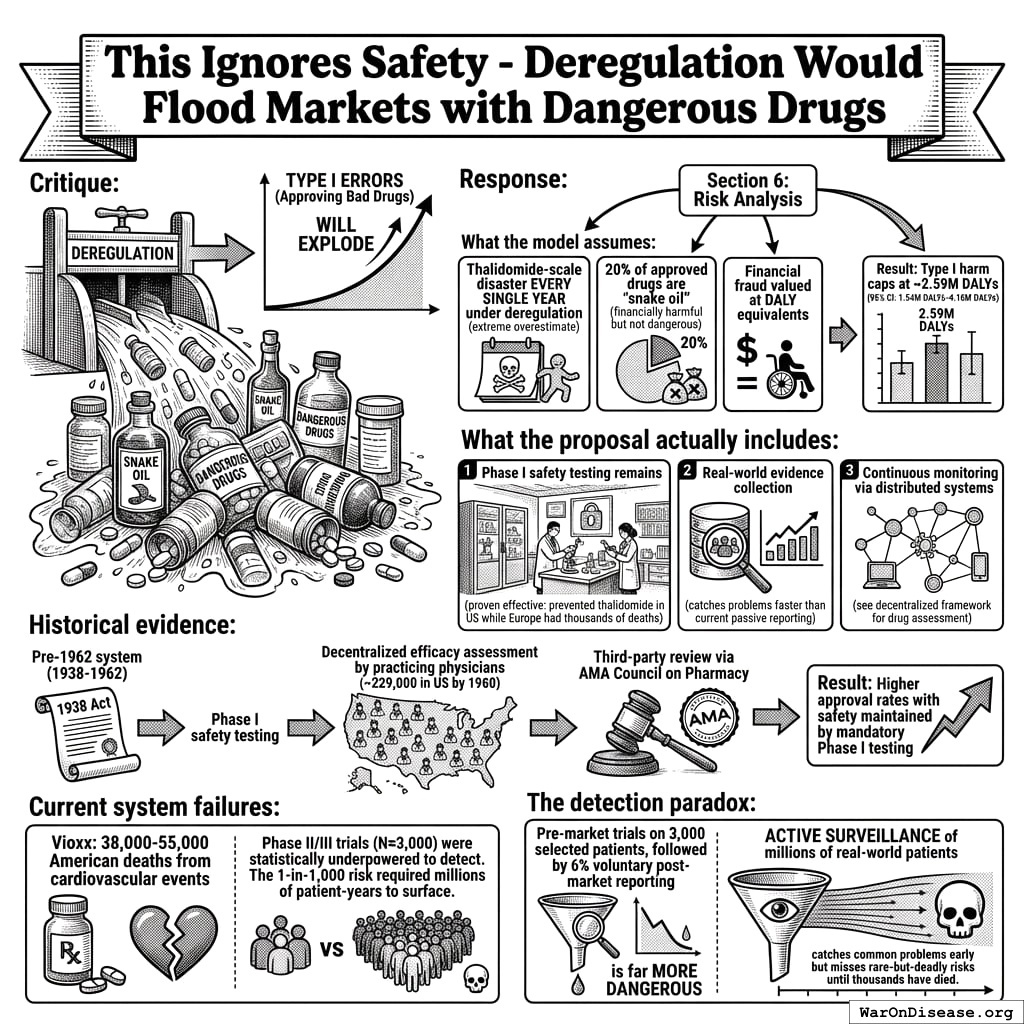
19.5 “This Ignores Safety - Deregulation Would Flood Markets with Dangerous Drugs”
Critique: Without efficacy requirements, pharmaceutical companies will sell snake oil and dangerous drugs. Type I errors (approving bad drugs) will explode.
Response:
The analysis explicitly models this in Section 6: Risk Analysis.
What the model assumes:
- Thalidomide-scale disaster every single year under deregulation (extreme overestimate)
- 20% of approved drugs are “snake oil” (financially harmful but not dangerous)
- Financial fraud valued at DALY equivalents
Result: Type I harm caps at ~2.59 million DALYs (90% CI: 1.88 million DALYs-3.38 million DALYs)
What the proposal actually includes:
- Phase I safety testing remains (proven effective: prevented thalidomide in US while Europe had thousands of deaths)
- Real-world evidence collection (catches problems faster than current passive reporting)
- Continuous monitoring via distributed systems (see decentralized FDA)
Historical evidence:
The pre-1962 system (1938-1962) included:
- Phase I safety testing (mandated by 1938 Food, Drug, and Cosmetic Act)
- Decentralized efficacy assessment by practicing physicians (~229,000 in US by 1960)634
- Third-party review via AMA Council on Pharmacy provided independent evaluation
- Result: Higher approval rates with safety maintained by mandatory Phase I testing
Current system failures:
- Vioxx: 38,000-55,000 American deaths51 from cardiovascular events that Phase II/III trials (N≈3,000) were statistically underpowered to detect. The 1-in-1,000 risk required millions of patient-years to surface.
- Statistical reality: Trials with 3,000 patients cannot reliably detect adverse events rarer than ~1-in-1,000
The detection paradox: Pre-market trials on 3,000 selected patients, followed by 6% voluntary post-market reporting, is far more dangerous than active surveillance of millions of real-world patients. The current system catches common problems early but misses rare-but-deadly risks until thousands have died.
20 Conclusion
The quantitative evidence demonstrates that the 1962 Kefauver-Harris efficacy requirements have generated catastrophic human costs:
- 416 million eventually avoidable deaths from 8.2 years (90% CI: 4.84 years-11.5 years) timeline shift
- 8.77 billion DALYs (90% CI: 4.88 billion DALYs-13.2 billion DALYs) lost
- $1.32 quadrillion (90% CI: $676 trillion-$2.14 quadrillion) economic destruction (cumulative DALYs valued at $150,000 (90% CI: $100,384-$198,679)/DALY, standard WHO methodology)
- 3,389 (90% CI: 1,811-5,734) harm ratio (Type II vs. Type I errors)
The 3,389 (90% CI: 1,811-5,734) ratio demonstrates that these costs dwarf the benefits. The regulatory framework optimizes for bureaucratic risk minimization (avoiding blame for approvals) rather than population health maximization (saving lives).
The path forward is clear: maintain safety testing, eliminate efficacy delay, and deploy distributed real-world evidence systems.
References
1.
NIH Common Fund. NIH pragmatic trials: Minimal funding despite 30x cost advantage. NIH Common Fund: HCS Research Collaboratory https://commonfund.nih.gov/hcscollaboratory (2025)
The NIH Pragmatic Trials Collaboratory funds trials at $500K for planning phase, $1M/year for implementation-a tiny fraction of NIH’s budget. The ADAPTABLE trial cost $14 million for 15,076 patients (= $929/patient) versus $420 million for a similar traditional RCT (30x cheaper), yet pragmatic trials remain severely underfunded. PCORnet infrastructure enables real-world trials embedded in healthcare systems, but receives minimal support compared to basic research funding. Additional sources: https://commonfund.nih.gov/hcscollaboratory | https://pcornet.org/wp-content/uploads/2025/08/ADAPTABLE_Lay_Summary_21JUL2025.pdf | https://www.ncbi.nlm.nih.gov/pmc/articles/PMC5604499/
.2.
NIH. Antidepressant clinical trial exclusion rates. Zimmerman et al. https://pubmed.ncbi.nlm.nih.gov/26276679/ (2015)
Mean exclusion rate: 86.1% across 158 antidepressant efficacy trials (range: 44.4% to 99.8%) More than 82% of real-world depression patients would be ineligible for antidepressant registration trials Exclusion rates increased over time: 91.4% (2010-2014) vs. 83.8% (1995-2009) Most common exclusions: comorbid psychiatric disorders, age restrictions, insufficient depression severity, medical conditions Emergency psychiatry patients: only 3.3% eligible (96.7% excluded) when applying 9 common exclusion criteria Only a minority of depressed patients seen in clinical practice are likely to be eligible for most AETs Note: Generalizability of antidepressant trials has decreased over time, with increasingly stringent exclusion criteria eliminating patients who would actually use the drugs in clinical practice Additional sources: https://pubmed.ncbi.nlm.nih.gov/26276679/ | https://pubmed.ncbi.nlm.nih.gov/26164052/ | https://www.wolterskluwer.com/en/news/antidepressant-trials-exclude-most-real-world-patients-with-depression
.3.
GiveWell. GiveWell cost per life saved for top charities (2024). GiveWell: Top Charities https://www.givewell.org/charities/top-charities
General range: $3,000-$5,500 per life saved (GiveWell top charities) Helen Keller International (Vitamin A): $3,500 average (2022-2024); varies $1,000-$8,500 by country Against Malaria Foundation: $5,500 per life saved New Incentives (vaccination incentives): $4,500 per life saved Malaria Consortium (seasonal malaria chemoprevention): $3,500 per life saved VAS program details: $2 to provide vitamin A supplements to child for one year Note: Figures accurate for 2024. Helen Keller VAS program has wide country variation ($1K-$8.5K) but $3,500 is accurate average. Among most cost-effective interventions globally Additional sources: https://www.givewell.org/charities/top-charities | https://www.givewell.org/charities/helen-keller-international | https://ourworldindata.org/cost-effectiveness
.4.
World Health Organization. WHO global health estimates 2024. World Health Organization https://www.who.int/data/gho/data/themes/mortality-and-global-health-estimates (2024)
Comprehensive mortality and morbidity data by cause, age, sex, country, and year Global mortality: 55-60 million deaths annually Lives saved by modern medicine (vaccines, cardiovascular drugs, oncology): 12M annually (conservative aggregate) Leading causes of death: Cardiovascular disease (17.9M), Cancer (10.3M), Respiratory disease (4.0M) Note: Baseline data for regulatory mortality analysis. Conservative estimate of pharmaceutical impact based on WHO immunization data (4.5M/year from vaccines) + cardiovascular interventions (3.3M/year) + oncology (1.5M/year) + other therapies. Additional sources: https://www.who.int/data/gho/data/themes/mortality-and-global-health-estimates
.5.
U.S. Bureau of Labor Statistics. CPI inflation calculator. (2024)
CPI-U (1980): 82.4 CPI-U (2024): 313.5 Inflation multiplier (1980-2024): 3.80× Cumulative inflation: 280.48% Average annual inflation rate: 3.08% Note: Official U.S. government inflation data using Consumer Price Index for All Urban Consumers (CPI-U). Additional sources: https://www.bls.gov/data/inflation_calculator.htm
.6.
ACS CAN. Clinical trial patient participation rate. ACS CAN: Barriers to Clinical Trial Enrollment https://www.fightcancer.org/policy-resources/barriers-patient-enrollment-therapeutic-clinical-trials-cancer
Only 3-5% of adult cancer patients in US receive treatment within clinical trials About 5% of American adults have ever participated in any clinical trial Oncology: 2-3% of all oncology patients participate Contrast: 50-60% enrollment for pediatric cancer trials (<15 years old) Note: 20% of cancer trials fail due to insufficient enrollment; 11% of research sites enroll zero patients Additional sources: https://www.fightcancer.org/policy-resources/barriers-patient-enrollment-therapeutic-clinical-trials-cancer | https://hints.cancer.gov/docs/Briefs/HINTS_Brief_48.pdf
.7.
ScienceDaily. Global prevalence of chronic disease. ScienceDaily: GBD 2015 Study https://www.sciencedaily.com/releases/2015/06/150608081753.htm (2015)
2.3 billion individuals had more than five ailments (2013) Chronic conditions caused 74% of all deaths worldwide (2019), up from 67% (2010) Approximately 1 in 3 adults suffer from multiple chronic conditions (MCCs) Risk factor exposures: 2B exposed to biomass fuel, 1B to air pollution, 1B smokers Projected economic cost: $47 trillion by 2030 Note: 2.3B with 5+ ailments is more accurate than "2B with chronic disease." One-third of all adults globally have multiple chronic conditions Additional sources: https://www.sciencedaily.com/releases/2015/06/150608081753.htm | https://pmc.ncbi.nlm.nih.gov/articles/PMC10830426/ | https://pmc.ncbi.nlm.nih.gov/articles/PMC6214883/
.8.
C&EN. Annual number of new drugs approved globally: 50. C&EN https://cen.acs.org/pharmaceuticals/50-new-drugs-received-FDA/103/i2 (2025)
50 new drugs approved annually Additional sources: https://cen.acs.org/pharmaceuticals/50-new-drugs-received-FDA/103/i2 | https://www.fda.gov/drugs/development-approval-process-drugs/novel-drug-approvals-fda
.9.
IQVIA Report. Global trial capacity. IQVIA Report: Clinical Trial Subjects Number Drops Due to Decline in COVID-19 Enrollment https://gmdpacademy.org/news/iqvia-report-clinical-trial-subjects-number-drops-due-to-decline-in-covid-19-enrollment/
1.9M participants annually (2022, post-COVID normalization from 4M peak in 2021) Additional sources: https://gmdpacademy.org/news/iqvia-report-clinical-trial-subjects-number-drops-due-to-decline-in-covid-19-enrollment/
.10.
Nature Medicine. Drug repurposing rate ( 30%). Nature Medicine https://www.nature.com/articles/s41591-024-03233-x (2024)
Approximately 30% of drugs gain at least one new indication after initial approval. Additional sources: https://www.nature.com/articles/s41591-024-03233-x
.11.
Biotechnology Innovation Organization (BIO). BIO clinical development success rates 2011-2020. Biotechnology Innovation Organization (BIO) https://go.bio.org/rs/490-EHZ-999/images/ClinicalDevelopmentSuccessRates2011_2020.pdf (2021)
Phase I duration: 2.3 years average Total time to market (Phase I-III + approval): 10.5 years average Phase transition success rates: Phase I→II: 63.2%, Phase II→III: 30.7%, Phase III→Approval: 58.1% Overall probability of approval from Phase I: 12% Note: Largest publicly available study of clinical trial success rates. Efficacy lag = 10.5 - 2.3 = 8.2 years post-safety verification. Additional sources: https://go.bio.org/rs/490-EHZ-999/images/ClinicalDevelopmentSuccessRates2011_2020.pdf
.12.
Institute for Health Metrics and Evaluation (IHME). IHME global burden of disease 2021 (2.88B DALYs, 1.13B YLD). Institute for Health Metrics and Evaluation (IHME) https://vizhub.healthdata.org/gbd-results/ (2024)
In 2021, global DALYs totaled approximately 2.88 billion, comprising 1.75 billion Years of Life Lost (YLL) and 1.13 billion Years Lived with Disability (YLD). This represents a 13% increase from 2019 (2.55B DALYs), largely attributable to COVID-19 deaths and aging populations. YLD accounts for approximately 39% of total DALYs, reflecting the substantial burden of non-fatal chronic conditions. Additional sources: https://vizhub.healthdata.org/gbd-results/ | https://www.thelancet.com/journals/lancet/article/PIIS0140-6736(24)00757-8/fulltext | https://www.healthdata.org/research-analysis/about-gbd
.13.
Sinn, M. P. Private industry clinical trial spending estimate. (2025)
Estimated private pharmaceutical and biotech clinical trial spending is approximately $75-90 billion annually, representing roughly 90% of global clinical trial spending.
14.
Sinn, M. P. The Political Dysfunction Tax. https://manual.warondisease.org/knowledge/appendix/political-dysfunction-tax.html (2025) doi:10.5281/zenodo.18603840
Quantifying the gap between current global governance and theoretical maximum welfare, estimating a 31-53% efficiency score and $101 trillion in annual opportunity costs.
15.
World Health Organization. Life expectancy at age 60 (years): Global health observatory. (2021).
16.
SIPRI. Global military spending ($2.72T, 2024). SIPRI https://www.sipri.org/publications/2025/sipri-fact-sheets/trends-world-military-expenditure-2024 (2025).
17.
PMC. Only 12% of human interactome targeted. PMC https://pmc.ncbi.nlm.nih.gov/articles/PMC10749231/ (2023)
Mapping 350,000+ clinical trials showed that only 12% of the human interactome has ever been targeted by drugs. Additional sources: https://pmc.ncbi.nlm.nih.gov/articles/PMC10749231/
.18.
Calculated from Orphanet Journal of Rare Diseases (2024). Diseases getting first effective treatment each year. Calculated from Orphanet Journal of Rare Diseases (2024) https://ojrd.biomedcentral.com/articles/10.1186/s13023-024-03398-1 (2024)
Under the current system, approximately 10-15 diseases per year receive their FIRST effective treatment. Calculation: 5% of 7,000 rare diseases ( 350) have FDA-approved treatment, accumulated over 40 years of the Orphan Drug Act = 9 rare diseases/year. Adding 5-10 non-rare diseases that get first treatments yields 10-20 total. FDA approves 50 drugs/year, but many are for diseases that already have treatments (me-too drugs, second-line therapies). Only 15 represent truly FIRST treatments for previously untreatable conditions.
19.
PMC. Standard medical research ROI ($20k-$100k/QALY). PMC: Cost-effectiveness Thresholds Used by Study Authors https://pmc.ncbi.nlm.nih.gov/articles/PMC10114019/ (1990)
Typical cost-effectiveness thresholds for medical interventions in rich countries range from $50,000 to $150,000 per QALY. The Institute for Clinical and Economic Review (ICER) uses a $100,000-$150,000/QALY threshold for value-based pricing. Between 1990-2021, authors increasingly cited $100,000 (47% by 2020-21) or $150,000 (24% by 2020-21) per QALY as benchmarks for cost-effectiveness. Additional sources: https://pmc.ncbi.nlm.nih.gov/articles/PMC10114019/ | https://icer.org/our-approach/methods-process/cost-effectiveness-the-qaly-and-the-evlyg/
.20.
Tufts CSDD. Cost of drug development.
Various estimates suggest $1.0 - $2.5 billion to bring a new drug from discovery through FDA approval, spread across 10 years. Tufts Center for the Study of Drug Development often cited for $1.0 - $2.6 billion/drug. Industry reports (IQVIA, Deloitte) also highlight $2+ billion figures.
21.
Lichtenberg, F. R. How many life-years have new drugs saved? A three-way fixed-effects analysis of 66 diseases in 27 countries, 2000-2013. International Health 11, 403–416 (2019)
Using 3-way fixed-effects methodology (disease-country-year) across 66 diseases in 22 countries, this study estimates that drugs launched after 1981 saved 148.7 million life-years in 2013 alone. The regression coefficients for drug launches 0-11 years prior (beta=-0.031, SE=0.008) and 12+ years prior (beta=-0.057, SE=0.013) on years of life lost are highly significant (p<0.0001). Confidence interval for life-years saved: 79.4M-239.8M (95 percent CI) based on propagated standard errors from Table 2.
22.
Nature Reviews Drug Discovery. Drug trial success rate from phase i to approval. Nature Reviews Drug Discovery: Clinical Success Rates https://www.nature.com/articles/nrd.2016.136 (2016)
Overall Phase I to approval: 10-12.8% (conventional wisdom 10%, studies show 12.8%) Recent decline: Average LOA now 6.7% for Phase I (2014-2023 data) Leading pharma companies: 14.3% average LOA (range 8-23%) Varies by therapeutic area: Oncology 3.4%, CNS/cardiovascular lowest at Phase III Phase-specific success: Phase I 47-54%, Phase II 28-34%, Phase III 55-70% Note: 12% figure accurate for historical average. Recent data shows decline to 6.7%, with Phase II as primary attrition point (28% success) Additional sources: https://www.nature.com/articles/nrd.2016.136 | https://pmc.ncbi.nlm.nih.gov/articles/PMC6409418/ | https://academic.oup.com/biostatistics/article/20/2/273/4817524
.23.
Research and Markets. Global clinical trials market 2024. Research and Markets https://www.globenewswire.com/news-release/2024/04/19/2866012/0/en/Global-Clinical-Trials-Market-Research-Report-2024-An-83-16-Billion-Market-by-2030-AI-Machine-Learning-and-Blockchain-will-Transform-the-Clinical-Trials-Landscape.html (2024)
Global clinical trials market valued at approximately $83 billion in 2024, with projections to reach $83-132 billion by 2030. Additional sources: https://www.globenewswire.com/news-release/2024/04/19/2866012/0/en/Global-Clinical-Trials-Market-Research-Report-2024-An-83-16-Billion-Market-by-2030-AI-Machine-Learning-and-Blockchain-will-Transform-the-Clinical-Trials-Landscape.html | https://www.precedenceresearch.com/clinical-trials-market
.24.
SofproMed. Phase 3 cost per trial range. SofproMed https://www.sofpromed.com/how-much-does-a-clinical-trial-cost
Phase 3 clinical trials cost between $20 million and $282 million per trial, with significant variation by therapeutic area and trial complexity. Additional sources: https://www.sofpromed.com/how-much-does-a-clinical-trial-cost | https://www.cbo.gov/publication/57126
.25.
Ramsberg, J. & Platt, R. Pragmatic trial cost per patient (median $97). Learning Health Systems https://pmc.ncbi.nlm.nih.gov/articles/PMC6508852/ (2018)
Meta-analysis of 108 embedded pragmatic clinical trials (2006-2016). The median cost per patient was $97 (IQR $19–$478), based on 2015 dollars. 25% of trials cost <$19/patient; 10 trials exceeded $1,000/patient. U.S. studies median $187 vs non-U.S. median $27. Additional sources: https://pmc.ncbi.nlm.nih.gov/articles/PMC6508852/
.26.
Kinch, M. S. & Griesenauer, R. H. Lost medicines: A longer view of the pharmaceutical industry with the potential to reinvigorate discovery. Drug Discovery Today 24, 875–880 (2019)
Research identified 1,600+ medicines available in 1962. The 1950s represented industry high-water mark with >30 new products in five of ten years; this rate would not be replicated until late 1990s. More than half (880) of these medicines were lost following implementation of Kefauver-Harris Amendment. The peak of 1962 would not be seen again until early 21st century. By 2016 number of organizations actively involved in R&D at level not seen since 1914.
27.
Baily, M. N. Pre-1962 drug development costs (baily 1972). Baily (1972) https://samizdathealth.org/wp-content/uploads/2020/12/hlthaff.1.2.6.pdf (1972)
Pre-1962: Average cost per new chemical entity (NCE) was $6.5 million (1980 dollars) Inflation-adjusted to 2024 dollars: $6.5M (1980) ≈ $22.5M (2024), using CPI multiplier of 3.46× Real cost increase (inflation-adjusted): $22.5M (pre-1962) → $2,600M (2024) = 116× increase Note: This represents the most comprehensive academic estimate of pre-1962 drug development costs based on empirical industry data Additional sources: https://samizdathealth.org/wp-content/uploads/2020/12/hlthaff.1.2.6.pdf
.28.
Think by Numbers. Pre-1962 physician-led clinical trials. Think by Numbers: How Many Lives Does FDA Save? https://thinkbynumbers.org/health/how-many-net-lives-does-the-fda-save/ (1966)
Pre-1962: Physicians could report real-world evidence directly 1962 Drug Amendments replaced "premarket notification" with "premarket approval", requiring extensive efficacy testing Impact: New regulatory clampdown reduced new treatment production by 70%; lifespan growth declined from 4 years/decade to 2 years/decade Drug Efficacy Study Implementation (DESI): NAS/NRC evaluated 3,400+ drugs approved 1938-1962 for safety only; reviewed >3,000 products, >16,000 therapeutic claims FDA has had authority to accept real-world evidence since 1962, clarified by 21st Century Cures Act (2016) Note: Specific "144,000 physicians" figure not verified in sources Additional sources: https://thinkbynumbers.org/health/how-many-net-lives-does-the-fda-save/ | https://www.fda.gov/drugs/enforcement-activities-fda/drug-efficacy-study-implementation-desi | http://www.nasonline.org/about-nas/history/archives/collections/des-1966-1969-1.html
.29.
Oren Cass, Manhattan Institute. RECOVERY trial cost per patient. Oren Cass https://manhattan.institute/article/slow-costly-clinical-trials-drag-down-biomedical-breakthroughs (2023)
The RECOVERY trial, for example, cost only about $500 per patient... By contrast, the median per-patient cost of a pivotal trial for a new therapeutic is around $41,000. Additional sources: https://manhattan.institute/article/slow-costly-clinical-trials-drag-down-biomedical-breakthroughs
.30.
NHS England; Águas et al. RECOVERY trial global lives saved ( 1 million). NHS England: 1 Million Lives Saved https://www.england.nhs.uk/2021/03/covid-treatment-developed-in-the-nhs-saves-a-million-lives/ (2021)
Dexamethasone saved 1 million lives worldwide (NHS England estimate, March 2021, 9 months after discovery). UK alone: 22,000 lives saved. Methodology: Águas et al. Nature Communications 2021 estimated 650,000 lives (range: 240,000-1,400,000) for July-December 2020 alone, based on RECOVERY trial mortality reductions (36% for ventilated, 18% for oxygen-only patients) applied to global COVID hospitalizations. June 2020 announcement: Dexamethasone reduced deaths by up to 1/3 (ventilated patients), 1/5 (oxygen patients). Impact immediate: Adopted into standard care globally within hours of announcement. Additional sources: https://www.england.nhs.uk/2021/03/covid-treatment-developed-in-the-nhs-saves-a-million-lives/ | https://www.nature.com/articles/s41467-021-21134-2 | https://pharmaceutical-journal.com/article/news/steroid-has-saved-the-lives-of-one-million-covid-19-patients-worldwide-figures-show | https://www.recoverytrial.net/news/recovery-trial-celebrates-two-year-anniversary-of-life-saving-dexamethasone-result
.31.
Manhattan Institute. RECOVERY trial 82× cost reduction. Manhattan Institute: Slow Costly Trials https://manhattan.institute/article/slow-costly-clinical-trials-drag-down-biomedical-breakthroughs
RECOVERY trial: $500 per patient ($20M for 48,000 patients = $417/patient) Typical clinical trial: $41,000 median per-patient cost Cost reduction: 80-82× cheaper ($41,000 ÷ $500 ≈ 82×) Efficiency: $50 per patient per answer (10 therapeutics tested, 4 effective) Dexamethasone estimated to save >630,000 lives Additional sources: https://manhattan.institute/article/slow-costly-clinical-trials-drag-down-biomedical-breakthroughs | https://pmc.ncbi.nlm.nih.gov/articles/PMC9293394/
.32.
ICER. Value per QALY (standard economic value). ICER https://icer.org/wp-content/uploads/2024/02/Reference-Case-4.3.25.pdf (2024)
Standard economic value per QALY: $100,000–$150,000. This is the US and global standard willingness-to-pay threshold for interventions that add costs. Dominant interventions (those that save money while improving health) are favorable regardless of this threshold. Additional sources: https://icer.org/wp-content/uploads/2024/02/Reference-Case-4.3.25.pdf
.33.
FDA Study via NCBI. Trial costs, FDA study. FDA Study via NCBI https://www.ncbi.nlm.nih.gov/pmc/articles/PMC6248200/
Overall, the 138 clinical trials had an estimated median (IQR) cost of $19.0 million ($12.2 million-$33.1 million)... The clinical trials cost a median (IQR) of $41,117 ($31,802-$82,362) per patient. Additional sources: https://www.ncbi.nlm.nih.gov/pmc/articles/PMC6248200/
.34.
DOT. DOT value of statistical life ($13.6M). DOT: VSL Guidance 2024 https://www.transportation.gov/office-policy/transportation-policy/revised-departmental-guidance-on-valuation-of-a-statistical-life-in-economic-analysis (2024)
Current VSL (2024): $13.7 million (updated from $13.6M) Used in cost-benefit analyses for transportation regulations and infrastructure Methodology updated in 2013 guidance, adjusted annually for inflation and real income VSL represents aggregate willingness to pay for safety improvements that reduce fatalities by one Note: DOT has published VSL guidance periodically since 1993. Current $13.7M reflects 2024 inflation/income adjustments Additional sources: https://www.transportation.gov/office-policy/transportation-policy/revised-departmental-guidance-on-valuation-of-a-statistical-life-in-economic-analysis | https://www.transportation.gov/regulations/economic-values-used-in-analysis
.35.
Peltzman, S. An evaluation of consumer protection legislation: The 1962 drug amendments. Journal of Political Economy 81, 1049–1091 (1973)
Foundational study quantifying the costs of the 1962 Kefauver-Harris Amendments. Peltzman estimated that the efficacy requirements reduced the flow of new drugs by 50-60% and that the costs of reduced innovation substantially exceeded the benefits of keeping ineffective drugs off the market. Concluded that the 1962 amendments resulted in net welfare losses.
36.
Wardell, W. M. Therapeutic implications of the drug lag. Clinical Pharmacology and Therapeutics 15, 73–96 (1974)
Documented the "drug lag" between US and UK drug approvals. Found that the UK had access to significantly more new drugs than the US, and that many effective drugs available in Europe were unavailable to American patients. Estimated beta-blockers alone could save 10,000 lives annually if approved in the US. Foundational work demonstrating the mortality cost of regulatory delay.
37.
FEE. Patients and doctors vs FDA. FEE: Patients and Doctors vs FDA https://fee.org/articles/patients-and-doctors-vs-the-fda
Dale Gieringer (1985): 21,000-120,000 lives lost per decade from FDA delay Gieringer: "Loss of life from delay alone in the hundreds of thousands" (not millions) Beta-blockers alone: William Wardell estimated "10,000 lives/year" if allowed; FDA delay 1965-1976 Sam Peltzman: Post-1962 death toll from regulatory delay "easily number in thousands per year Practolol (beta-blocker): "Could save 10,000 lives/year" (Wardell estimate) FDA allowed propranolol 1968 (3 years after Europe); for hypertension/angina not until 1978 Note: "4-10 million" figure not found in sources. Gieringer’s estimates: 21K-120K deaths per decade, "hundreds of thousands" total (not millions). Specific drug delays (beta-blockers): 100K deaths estimated Additional sources: https://fee.org/articles/patients-and-doctors-vs-the-fda | https://www.econlib.org/library/Enc/DrugLag.html | https://www.fdareview.org/issues/theory-evidence-and-examples-of-fda-harm/
.38.
Fischl, M. A. et al. The efficacy of azidothymidine (AZT) in the treatment of patients with AIDS and AIDS-related complex: A double-blind, placebo-controlled trial. New England Journal of Medicine 317, 185–191 (1987)
Landmark Phase 2 trial of AZT in 282 AIDS patients. 19 placebo recipients died vs. 1 AZT recipient (P < 0.001). Trial stopped early due to overwhelming efficacy. Led to FDA approval in record 107 days.
39.
Institute for Health Metrics and Evaluation (IHME). IHME global burden of disease (2.55B DALYs, 2019). Institute for Health Metrics and Evaluation (IHME) https://vizhub.healthdata.org/gbd-compare/ (2020)
Globally, in 2019, the total number of DALYs from all causes was 2.55 billion. Additional sources: https://vizhub.healthdata.org/gbd-compare/ | https://www.healthdata.org/research-analysis/about-gbd | https://pubmed.ncbi.nlm.nih.gov/33069326/
.40.
WHO. 80% of cardiovascular disease is preventable. WHO: Cardiovascular diseases (CVDs)) https://www.who.int/news-room/fact-sheets/detail/cardiovascular-diseases-(cvds) (2021)
As many as 80% of all heart attacks and strokes are preventable" through addressing lifestyle risk factors WHO: Most cardiovascular diseases can be prevented by addressing behavioral and environmental risk factors such as tobacco use, unhealthy diet, obesity, physical inactivity, harmful use of alcohol, and air pollution Cleveland Clinic: "90 percent of heart disease is preventable through healthier diet, regular exercise, and not smoking In 2 large cohort studies, a reduction of CVD risk of >80% and diabetes >90% were demonstrated in individuals who followed healthy lifestyle practices Only 5% of individuals follow all lifestyle factors for "ideal" cardiovascular health (American Heart Association) Additional sources: https://www.who.int/news-room/fact-sheets/detail/cardiovascular-diseases-(cvds) | https://world-heart-federation.org/what-we-do/prevention/ | https://newsroom.clevelandclinic.org/2021/09/29/90-percent-of-heart-disease-is-preventable-through-healthier-diet-regular-exercise-and-not-smoking | https://www.ncbi.nlm.nih.gov/pmc/articles/PMC162259/
.41.
PMC. 30-50% of cancer is currently preventable; 90-95% has environmental/lifestyle roots. PMC: Cancer is a Preventable Disease https://pmc.ncbi.nlm.nih.gov/articles/PMC2515569/
IARC/WHO: Environmental and lifestyle factors contribute to about 50% of the global cancer burden; expected to contribute to remaining 50% for which causes currently unknown WHO: 35% of cancer deaths worldwide are due to potentially preventable or modifiable risk factors PMC: "Only 5-10% of all cancer cases can be attributed to genetic defects, whereas the remaining 90-95% have their roots in the environment and lifestyle Breakdown: 25-30% due to tobacco, 30-35% linked to diet, 15-20% due to infections, remainder from radiation, stress, physical activity, pollutants US: 4 out of 10 cancer cases associated with preventable risk factors (tobacco/alcohol use, physical inactivity) Note: Current preventability ( 35-40%) vs. theoretical max (90-95% if all environmental/lifestyle factors addressed) Additional sources: https://pmc.ncbi.nlm.nih.gov/articles/PMC2515569/ | https://www.iarc.who.int/branches-env/ | https://cancerprogressreport.aacr.org/progress/cpr22-contents/cpr22-preventing-cancer-identifying-risk-factors/
.42.
PMC. Aging reversal demonstrated in mammals using yamanaka factors. PMC: Chemically Induced Reprogramming to Reverse Aging https://pmc.ncbi.nlm.nih.gov/articles/PMC10373966/ (2023)
Harvard/Sinclair: Loss of epigenetic information causes aging; restoring epigenome integrity reverses aging signs in mice OSK therapy (Oct4, Sox2, Klf4): Ectopic induction can restore youthful DNA methylation patterns, transcript profiles, and tissue function without erasing cellular identity Results in mice: Systemically delivered adeno-associated viruses encoding inducible OSK in 124-week-old mice extended median remaining lifespan by 109% over wild-type controls Vision restored in glaucoma mice - first successful reversal (not just halting progression) Cyclic partial reprogramming (2 days on, 5 days off) showed improvements after just 6 weeks including reduced age-related spinal curvature Human cells: Babraham Institute showed cellular reprogramming reverses epigenetic age of human skin cells by 30 years Chemical alternatives: Six chemical cocktails identified that restore youthful genome-wide transcript profile in less than a week without compromising cellular identity Note: Demonstrates biological aging is reversible, not inevitable; safety testing ongoing before human application Additional sources: https://pmc.ncbi.nlm.nih.gov/articles/PMC10373966/ | https://www.nature.com/articles/s41467-024-46020-5 | https://www.liebertpub.com/doi/10.1089/cell.2023.0072 | https://clinicalepigeneticsjournal.biomedcentral.com/articles/10.1186/s13148-021-01158-7
.43.
WHO. Injuries are largely preventable events. WHO: Injuries and Violence Fact Sheet https://www.who.int/news-room/fact-sheets/detail/injuries-and-violence
WHO: "Injuries have traditionally been regarded as random, unavoidable ’accidents’. Today both unintentional and intentional injuries are viewed as largely preventable events. 4.4 million injury-related deaths annually: 3.16M unintentional, 1.25M violence-related Injuries are preventable by changing environment, individual behavior, products, social norms, legislation, and governmental/institutional policies When standardized per 100,000 population, death rate is nearly double in low/middle-income vs high-income countries (65 vs 35 per 100,000) 90% of injury-related deaths occur in low- and middle-income countries Note: 60% of accidental deaths theoretically preventable through policy, technology, and behavior change; 40% involve instantaneous trauma beyond medical intervention Additional sources: https://www.who.int/news-room/fact-sheets/detail/injuries-and-violence | https://pmc.ncbi.nlm.nih.gov/articles/PMC2912603/ | https://www.who.int/publications-detail-redirect/the-injury-chart-book-a-graphical-overview-of-the-global-burden-of-injuries
.44.
Furuyama, K. et al. Endogenous reprogramming of alpha cells into beta cells, induced by viral gene therapy, reverses autoimmune diabetes. Cell Stem Cell 24, 87–100 (2019)
Used AAV-mediated gene therapy to deliver Pdx1 and MafA to mouse pancreas, reprogramming alpha cells into functional insulin-producing beta cells. Reversed autoimmune diabetes in mice, demonstrating gene therapy potential for T1D reversal.
45.
PMC. Stem cell therapy shows promise for neurodegenerative diseases. PMC: Regenerative Stem Cell Therapy for Neurodegenerative Diseases https://pmc.ncbi.nlm.nih.gov/articles/PMC7926761/ (2023)
R3 paradigm: Rejuvenation (restoring cell function), Regeneration (stimulating repair), Replacement (substituting lost cells) Alzheimer’s: Stanford study showed stem cell transplants reduced brain abnormalities in mice; Neural Stem Cell Therapy shown to improve cognitive function and reduce amyloid plaques Parkinson’s: Clinical trial found Neural Stem Cell Therapy significantly improved motor function and was well-tolerated ALS/Huntington’s: MSC (mesenchymal stem cell) therapy effectiveness confirmed; slows ALS progression Challenge: Clinical trials often enroll patients at advanced stages; many preclinically promising drugs ineffective in late-stage human trials Current status: Largely experimental and early clinical trial stages; researchers working to overcome delivery challenges, safety concerns, and targeting widespread neuronal damage Note: 80% theoretical max for neurodegenerative reflects early-stage intervention potential; current treatments limited ( 10% effective) Additional sources: https://pmc.ncbi.nlm.nih.gov/articles/PMC7926761/ | https://med.stanford.edu/news/all-news/2023/09/stem-cell-alzheimers.html | https://stemcellres.biomedcentral.com/articles/10.1186/s13287-025-04285-7
.46.
AAF. Return on investment for vaccines. AAF https://www.americanactionforum.org/research/vaccine-protection-and-productivity-the-economic-value-of-vaccines/ (2011)
Every $1 spent on childhood immunizations results in approximately $11 in savings (700% ROI). For low/middle-income countries: $26.1-$51.0 ROI using cost-of-illness approach, $52.2 ROI using value-of-statistical-life approach. US childhood vaccines 1994-2023 saved $540B in direct costs, $2.7T in total societal savings. Additional sources: https://www.americanactionforum.org/research/vaccine-protection-and-productivity-the-economic-value-of-vaccines/ | https://www.healthaffairs.org/doi/10.1377/hlthaff.2020.00103 | https://immunizationevidence.org/featured_issues/the-value-of-vaccines-investments-in-immunization-yield-high-returns/
.47.
IQVIA Institute for Human Data Science. The global use of medicines 2024: Outlook to 2028. IQVIA Institute Report https://www.iqvia.com/insights/the-iqvia-institute/reports-and-publications/reports/the-global-use-of-medicines-2024-outlook-to-2028 (2024)
Global days of therapy reached 1.8 trillion in 2019 (234 defined daily doses per person). Diabetes, respiratory, CVD, and cancer account for 71 percent of medicine use. Projected to reach 3.8 trillion DDDs by 2028.
48.
Barter, P. J. et al. Torcetrapib and cardiovascular events: The ILLUMINATE trial. New England Journal of Medicine 357, 2109–2122 (2007)
Phase III trial of CETP inhibitor torcetrapib terminated early due to excess mortality. Of 15,067 participants, 82 deaths occurred in the torcetrapib arm vs. 51 in placebo (HR 1.58). Cardiovascular events were also significantly higher. Pfizer spent over $800 million on development before termination. Example of Phase III trial catching serious safety issues before broader approval.
49.
Doody, R. S. et al. A phase 3 trial of semagacestat for treatment of alzheimer’s disease. New England Journal of Medicine 369, 341–350 (2013)
Phase III trial of gamma-secretase inhibitor semagacestat for Alzheimer’s disease was terminated early by Eli Lilly. Patients on treatment showed significantly WORSE cognitive outcomes than placebo, plus increased skin cancers and infections. 1,537 patients randomized. Example of Phase III trial preventing approval of a drug that would have harmed patients.
50.
McDonald, C. M. et al. A randomized placebo-controlled phase 3 trial of drisapersen in duchenne muscular dystrophy. Neuromuscular Disorders 27, 1021–1029 (2017)
Phase III trial of drisapersen for Duchenne muscular dystrophy failed to show clinical benefit (P=0.415). FDA rejected approval in 2016 due to safety concerns including thrombocytopenia in 2% of patients, renal toxicity, and injection site reactions in 79% of patients. BioMarin discontinued development. Example of regulatory system preventing approval of ineffective drug with serious adverse effects.
51.
Graham, David (FDA) | Lancet. Vioxx cardiovascular deaths (rofecoxib). PMC: FDA incapable of protecting against another Vioxx https://pmc.ncbi.nlm.nih.gov/articles/PMC534432/ (2007)
Graham testimony (2004): 88,000-139,000 U.S. heart attacks/strokes from Vioxx; up to 55,000 deaths (40% fatality rate) Lancet study estimate: 88,000 Americans had heart attacks from Vioxx; 38,000 died FDA memo (2004): Vioxx contributed to 27,785 heart attacks and sudden cardiac deaths (1999-2003) High-dose Vioxx: Tripled risk of heart attacks and sudden cardiac death Prescriptions: 92.8 million U.S. prescriptions 1999-2003 Withdrawn: September 30, 2004 after APPROVE trial showed cardiovascular risks Note: Vioxx case demonstrates failure of passive post-market surveillance (FAERS) to detect safety signals in time. Voluntary reporting missed cardiovascular risks for years despite millions of prescriptions Additional sources: https://pmc.ncbi.nlm.nih.gov/articles/PMC534432/ | https://www.npr.org/2007/11/10/5470430/timeline-the-rise-and-fall-of-vioxx | https://www.thelancet.com/journals/lancet/article/PIIS0140-6736(05)67712-4/fulltext
.52.
Sinn, M. P. The Continuous Evidence Generation Protocol: Two-Stage Validation (RWE → Pragmatic Trials). https://papers.acceleratedmedicine.org/dfda-protocol.html (2025) doi:10.5281/zenodo.18203375
We present the Predictor Impact Score (PIS), a novel composite metric operationalizing Bradford Hill causality criteria for automated signal detection from aggregated N-of-1 observational studies. Combined with pragmatic trial confirmation (based on evidence from 108+ embedded trials), this two-stage framework would generate validated outcome labels at 44.1x lower cost than traditional Phase III trials. This enables continuous, population-scale pharmacovigilance and precision dosing recommendations.
53.
Sinn, M. P. Ubiquitous Pragmatic Trial Impact Analysis: How to Prevent a Year of Death and Suffering for 84 Cents. https://papers.acceleratedmedicine.org/dfda-impact.html (2025) doi:10.5281/zenodo.18243914
Only 15 diseases/year get their first treatment each year. With 6.65 thousand diseases lacking effective treatments, the backlog would take 443 years to clear. Integrating pragmatic trials into standard healthcare increases trial capacity 12.3x, cutting that timeline from 443 years to 36 years. The average untreated disease gets a treatment 212 years earlier, saving 10.7 billion deaths at $0.842 per year of healthy life saved.
54.
Sinn, M. P. The 1% Treaty. https://manual.warondisease.org/knowledge/solution/1-percent-treaty.html (2025) doi:10.5281/zenodo.20076511
Your governments possess nuclear weapons sufficient to end civilization 122 times but have not cured Alzheimer’s once. This treaty asks them to be 1% more rational.
55.
Sinn, M. P. The 1% Treaty: An Incentive-Compatible Approach to Ending War and Disease. https://manual.warondisease.org/knowledge/economics/1-pct-treaty-impact.html (2025) doi:10.5281/zenodo.18161560
6.65 thousand diseases have zero FDA-approved treatments; at current trial capacity, exploring them takes 443 years. Redirecting 1% of military spending scales capacity 12.3x, cutting the timeline to 36 years and preventing 10.7 billion deaths. At $0.00177/DALY, 50.3kx more cost-effective than the best existing interventions. The result holds across every specified adoption pathway.
56.
FDLI. Japan’s regenerative medicine act and conditional approval pathway. FDLI: Japan’s Regen Med Pathways https://www.fdli.org/2019/02/global-focus-japans-regenerative-medicine-regulatory-pathways-encouraging-innovation-and-patient-access/ (2019)
Act on Safety of Regenerative Medicine (RM Act) + amended Pharmaceuticals and Medical Devices Act (PMD Act): passed Nov 2013, effective Nov 2014 Conditional and time-limited approval pathway: Obtain approval after exploratory trials demonstrate probable benefit and proven safety 7-year conditional approval period to confirm clinical benefit (e.g., using surrogate endpoints) SAKIGAKE designation (April 2015): Expedited pathway for innovative products targeting serious/life-threatening diseases without effective treatment Benefits: Prioritized consultation, accelerated review, extended re-examination period, premium pricing Examples: Terumo’s HeartSheet and Stemirac obtained conditional approval; Stemirac also SAKIGAKE-designated Additional sources: https://www.fdli.org/2019/02/global-focus-japans-regenerative-medicine-regulatory-pathways-encouraging-innovation-and-patient-access/ | https://www.insights.bio/cell-and-gene-therapy-insights/journal/article/310/Experiences-from-Japan-SAKIGAKE-Designation-System-for-Regenerative-Medical-Products | https://pmc.ncbi.nlm.nih.gov/articles/PMC6696404/
.57.
Honmou, O. et al. Intravenous infusion of auto serum-expanded autologous mesenchymal stem cells in spinal cord injury patients: 13 case series. Clinical Neurology and Neurosurgery 203, 106565 (2021)
In this investigator-initiated clinical trial (2014-2017), 12 of 13 patients (92%) with cervical spinal cord injury who received MSC transplantation achieved at least one level of improvement on American Spinal Injury Association Impairment Scale. Five of six AIS A patients improved to AIS B (3/6) or AIS C (2/6). No severe side effects. Results led to MHLW conditional approval of STEMIRAC in December 2018.
58.
Yong, C. S. M., Deng, J., Tan, E. W., et al. Challenges in global access to CAR-t cells: An asian perspective. International Journal of Hematology https://pmc.ncbi.nlm.nih.gov/articles/PMC10937087/ (2024)
Reviews CAR-T cell therapy access across Asia. Japan has approved five CAR-T products under National Health Insurance: Kymriah, Yescarta, Breyanzi, Abecma, and Carvykti. All priced at 32,647,761 JPY. Japan’s high-cost medical care reimbursement system limits patient out-of-pocket costs.
59.
Noda, S. et al. Regulatory advancements in japan’s conditional and time-limited approval scheme for regenerative medical products. https://pubmed.ncbi.nlm.nih.gov/40100190/ (2025).
60.
Hosoya, S. et al. Detailed revisions to the subordinate regulation following the amendment of the act on the safety of regenerative medicine in japan. https://pmc.ncbi.nlm.nih.gov/articles/PMC12221229/ (2025).
61.
FDA. FDA sentinel initiative. FDA: Sentinel Initiative https://www.fda.gov/safety/fdas-sentinel-initiative
Launched: May 2008 in response to FDAAA 2007; transitioned to full system Feb 2016 Purpose: Active post-market risk identification and analysis (ARIA) for medical products Scale: World’s largest multisite distributed database for medical product safety; 128.7M members Data sources: Insurance claims, electronic health records, patient reports Privacy: Distributed data approach - data remains with owners, patient identifiers removed Structure (2019): 3 coordinating centers - Operations, Innovation, Community Building/Outreach Real-World Evidence: RWE Data Enterprise (RWE-DE) - 25.5M lives (21M commercial + 4.5M academic) 2008-2014: FDA mandated 657 studies under FDAAA authority Note: Major advancement in post-market surveillance. "Limited Transparency and Bureaucratic Constraints" may refer to challenges, but system represents significant FDA capability improvement Additional sources: https://www.fda.gov/safety/fdas-sentinel-initiative | https://pmc.ncbi.nlm.nih.gov/articles/PMC9667154/ | https://en.wikipedia.org/wiki/Sentinel_Initiative
.62.
U.S. Food and Drug Administration. FDA eliminates major barrier to using real-world evidence in drug and device application reviews. (2025).
63.
Institute of Medicine (US) Committee on the U.S. Physician Supply. U.s. Physician supply and requirements: Match or mismatch? The Nation’s Physician Workforce: Options for Balancing Supply and Requirements https://www.ncbi.nlm.nih.gov/books/NBK232541/ (1996)
Historical physician workforce data: 126.6 active nonfederal M.D. physicians per 100,000 population in 1950; 127.4 in 1960; 137.4 in 1970 (DHHS 1993). At 1960 US population of 180M, this corresponds to approximately 229,000 active physicians.
Footnotes
Furuyama et al. (2019) used AAV gene therapy to reprogram alpha cells into insulin-producing beta cells, reversing autoimmune diabetes in mice. Max potential extrapolates from root cause addressability.↩︎
WHO estimates 80% of COPD cases preventable through tobacco control and air quality improvements (see WHO COPD Fact Sheet). The 90% max potential conservatively assumes emerging regenerative medicine may address some remaining cases.↩︎
Calculated as weighted average of “Max Potential” estimates for categories with similar biological mechanisms.↩︎
Institute of Medicine data shows 127.4 active physicians per 100,000 population in 1960. At US population of ~180M, this equals approximately 229,000 active physicians.↩︎
Reuse
Copyright
© 2025 Mike P. Sinn